Uber Prof New FeaturesA better query plan
Originally posted at 1/7/2011
Because I keep getting asked, this feature is available for the following profilers:
- NHibernate Profiler
- Entity Framework Profiler
- Linq to SQL Profiler
- LLBLGen Profiler
- Hibernate Profiler
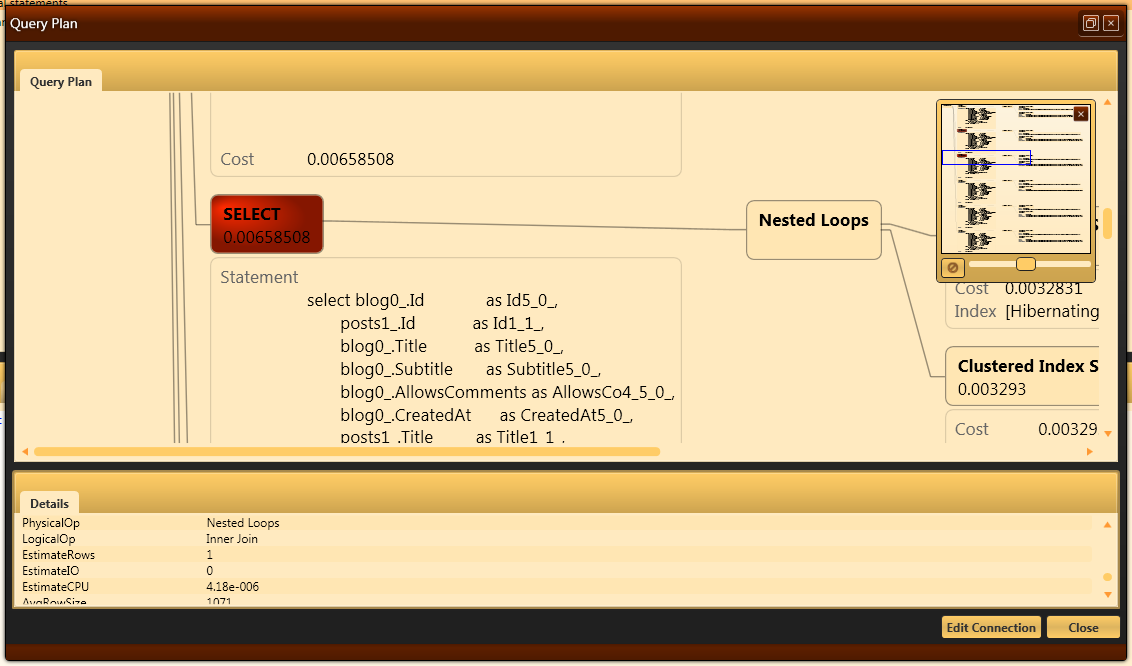
This feature is actually two separate ones. The first is the profiler detecting what is the most expensive part of the query plan and making it instantly visible. As you can see, in this fairly complex query, it is this select statement that is the hot spot.
Another interesting feature that only crops up whenever we are dealing with complex query plans is that the query plan can get big. And by that I mean really big. Too big for a single screen.
Therefore, we added zooming capabilities as well as the mini map that you see in the top right corner.
More posts in "Uber Prof New Features" series:
- (15 Jan 2011) A better query plan
- (14 Jan 2011) Go To Session from alert


Comments
Does the minimap disappear if your radar dome is destroyed?
What graph visualization package did you use? ILog?
Frans,
I think that we just use WPF.
Christopher handled the UI part
Comment preview