Last week we hosted a webinar to show case some of the fun stuff in RavenDB. The recording is now available:
A process running on your system is typically a black box. You don’t have a lot of insight into what is going on inside it. Oh, there are all sort of tools you can use to infer things out (looking at system calls, memory consumption, network connections, etc), but by default… it is a mystery.
RavenDB is a database. It is meant to run unattended for long durations and is designed to mostly run itself. That means that when you look at it, you want to be able to figure out exactly what is going on with the system as soon as possible. To that end, we have included a lot of features inside RavenDB that expose the internal state of the system. From tracing each I/O and its duration to providing detailed statistics about costs and amount of effort invested in various tasks.
These features are invaluable to figure out exactly what is going on in RavenDB at a particular point in time. Of course, nothing beats the ability to open a debugger and inspect the state of the system. But that is something that you can only really do on development. It is not something that can be done on production, obviously. Or can it?
Since RavenDB 3.0, we actually had just this feature, being able to ask RavenDB to capture and display its own state in a format that should be very familiar to developers. When we created RavenDB 4.0, we were able to carry on this feature on Windows (at some cost), but it was a complete non starter on Linux.
On Windows, a process can debug another process if they belong to the same user (somewhat of an over simplification, but good enough). On Linux, the situation is a lot more complex. A process can usually only debug another process if the debugger is running as root or is the parent process of the debugee process.
Another complication was that we are using ClrMD, a wonderful library that allow us to introspect live processes (among many other things). It did not have support for Linux, until about a month ago… as soon as we had the most basic of support there, we jumped into action, seeing how we can bring this feature to Linux as well. A lot of our users are running production systems on Linux, and the ability to look at the system and go: “Hmm. I wonder what this is doing” and then being able to tell is something that we consider a major boost to RavenDB.
It took a lot of fighting and learning a lot more about how debugging permissions work on Linux than I ever wanted to know. But we got it working (details below). You can see how this looks like on a live Linux server:
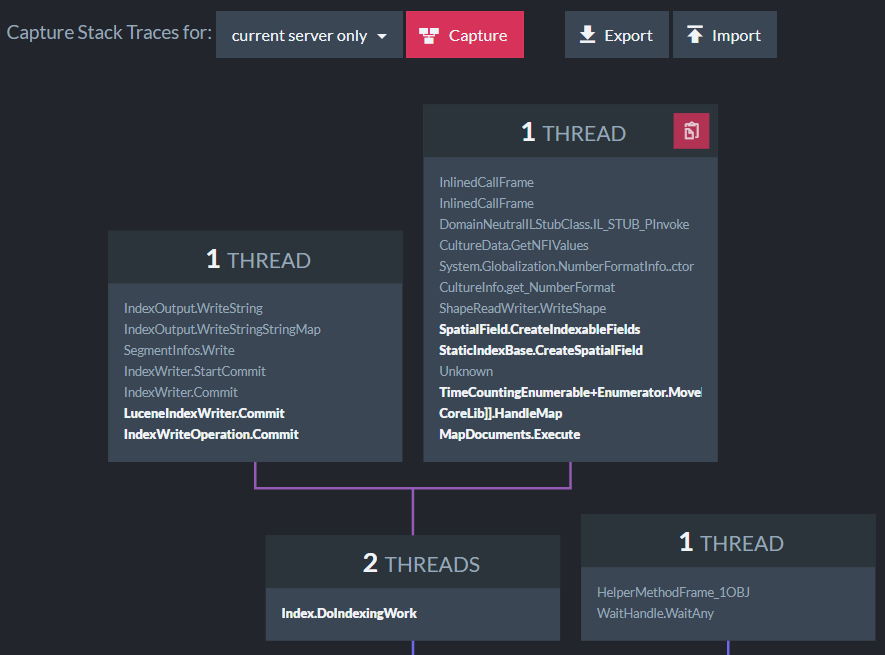
As you can see, there is an indexing thread here doing some work on spatial data. We are going to enhance this view further with the ability to see CPU times as well as job names. The idea is that this is something that you will look at and get enough insight to not need to check the logs or try to infer what is going on. You could just tell.
Now, for the gory details of how this works. We changed the implementation on both Windows and Linux to use passive attach to process, which is much faster. The first thing we tried, once we moved to passive attach is to debug ourselves.
This is a nice enough feature, and quite elegant. We debug ourselves, pull the stack traces and display the data. Unfortunately, this doesn’t work on Linux. A process cannot debug itself. All debugging in Linux is based on the ptrace() system call, and the permissions to that are as specified. I can’t imagine the security implications of letting a process debug itself. After all, it is already can do anything the process can do, because it is the process. But I guess that this is an esoteric enough scenario that no one noticed and then the reaction was, use a workaround.
The usual workaround is to have a process that would spawn RavenDB and then it would be able to debug it. That is… possible, but it would be a major shift in how we deploy, not something that I wanted to do. There is also the ptrace_scope flag, which is supposed to control this behavior. In my tests, at least, disabling the security checks via this flag did absolutely nothing.
Running as root worked, just fine, of course. And then the process crashed. On Linux, when trying to debug your own process, there seems to be an interesting interaction between the debugger and debuggee if an exception is thrown. To the point where it will corrupt the CoreCLR state and kill the process. That was a fun bug to trace, sort of. Linux has a escape hatch in the form of PR_SET_PTRACER option that can be used. However, you can’t designate your own process, unfortunately. That combined with the hard crashes, made self debugging a non starter.
But I still want this feature, and without changing too much about how we are doing things.
Here is what we ended up doing. We have a separate process just to capture the stack trace. When you ask RavenDB to get its stack trace, it will spawn this process, but ask it to wait. It will then grant the new process the permissions necessary to debug RavenDB and signal it to continue. At this point, the debugger child process will capture the stack trace and send it back to RavenDB. RavenDB will reset the permission, enhance the stack trace with additional information that we can provide from inside the process and display it to the user.
The actual debugger process is also marked with setcap to provide it additional permissions it needs. This separation means that we isolate these permissions to a single purpose tool that can be invoked and closed, without increasing the attack surface of RavenDB.
The end result is that you can walk to a production RavenDB server, running on Windows or Linux, and get better information than if you just attached to it with the debugger.
 This hits my email, and given the number of questions that our support team fields on the topic, I wanted to make sure it is widely known. You can now use RavenDB 4.2 as the backing store for your NServiceBus systems.
That, in turn, means that you can now use RavenDB 4.2 in your systems in general, which is going to be a much nicer experience overall and put you back on the supported path.
A note about support:
- RavenDB 3.0 is no longer supported.
- RavenDB 3.5 is supported until the end of 2020.
Many of the users who use RavenDB with NServiceBus tend to be larger enterprises, where updates to the technology stack may take a while. So it is better to start these things early.
And as an added incentive, based on over 18 months in the field, just by moving to RavenDB 4.2 you are going to get ten fold performance increase from RavenDB 3.5.
I started talking about this, and all of a sudden I got 45 minutes of pretty cool demo, even if I’m saying it myself.
In the video, I’m setting up RavenDB on a Raspberry PI, connect to it via the Python client API, connect it to the cloud and start working with widely distributed environment with bi-directional replication, ending up with using subscriptions to process data on the Raspberry PI that is coming from the cloud.
I would love your feedback on the video and the type of deployment that is outlined here.
One of the silent features of people moving to the cloud is that it make it the relation between performance and $$$ costs evident. In your on data center, it is easy to lose track between the yearly DC budget and the application performance. But on the cloud, you can track it quite easily.
The immediately lead people to try to optimize their costs and use the minimal amount of resources that they can get away with. This is great for people who believe in efficient software.
One of the results of the focus on price and performance has been the introduction of burstable cloud instances. These instances allow you to host machines that do not need the full machine resources to run effectively. There are many systems whose normal runtime cost is minimal, with only occasional spikes. In AWS, you have the T series and Azure has the B series. Given how often RavenDB is deployed on the cloud, it shouldn’t surprise you that we are frequently being run on such instances. The cost savings can be quite attractive, around 15% in most cases. And in the case of small instances, that can be even more impressive.
RavenDB can run quite nicely on a Raspberry PI, or a resource starved container, and for many workloads, that make sense. Looking at AWS in this case, consider the t3a.medium instance with 2 cores and 4 GB at 27.4$ / month vs. a1.large (the smallest non burstable instance) with the same spec (but ARM machine) at 37.2$ per month. For that matter, a t3a.small with 2 cores and 2 GB of memory is 13.7$. As you can see, the cost savings adds up, and it make a lot of sense to want to use the most cost effective solution.
Enter the problem with burstable instances. They are bursty. That means that you have two options when you need more resources. Either you end up with throttling (reducing the amount of CPU that you can use) or you are being charged for the additional extra CPU power you used.
Our own production systems, running all of our sites and backend systems are running on a cluster of 3 t3.large instances. As I mentioned, the cost savings are significant. But what happens when you go above the limit? In our production systems, for the past 6 months, we have never had an instance where RavenDB used more than the provided burstable performance. It helps that the burstable machines allows us to accrue CPU time when we aren’t using it, but overall it means that we are doing a good job of handling requests efficiently. Here are some metrics from one of the nodes in the cluster during a somewhat slow period (the range is usually 20 – 200 requests / sec).
So we are pretty good in terms of latency and resource utilizations, that’s great.
However, the immediately response to seeing that we aren’t hitting the system limits is… to reduce the machine size again, to pay even less. There is a lot of material on cost optimization in the cloud that you can read, but that isn’t the point of this post. One of the more interesting choices you can make with burstable instances is to ask to not go over the limit. If your system is using too much CPU, just take it away until it is done. Some workloads are just fine for this, because there is no urgency. Some workloads, such as servicing requests, are less kind to this sort of setup. Regardless, this is a common enough deployment model that we have to take it into account.
Let’s consider the worst case scenario from our perspective. We have a user that runs the cheapest possible instance a t3a.nano with 2 cores and 512 MB of RAM costing just 3.4$ a month. The caveat with this instance is that you have just 6 CPU credits / hour to your name. A CPU credit is basically 100% CPU for 1 minute. Another way of looking at this is that t t3a.nano instance has a budget of 360 CPU seconds per hour. If it uses more than that, it is charged a hefty fee (about ten times per hour than the machine cost). So we have users that disable the ability to go over the budget.
Now, let’s consider what is going to happen to such an instance when it hits an unexpected load. In the context of RavenDB, it can be that you created a new index on a big collection. But something seemingly simple such as generating a client certificate can also have a devastating impact on such an instance.RavenDB generates client certificates with 4096 bits keys. On my machine (nice powerful dev machine), that can take anything from 300 – 900 ms of CPU time and cause a noticeable spike in one of the cores:
On the nano machine, we have measured key creation time of over six minutes.
The answer isn’t that my machine is 800 times more powerful than the cloud machine. The problem is that this takes enough CPU time to consume all the available credits, which cause throttling. At this point, we are in a sad state. Any additional CPU credits (and time) that we earn goes directly to the already existing computation. That means that any other CPU time is pushed back. Way back. This happens at a level below the operating system (at the hypervisor), so there it isn’t even aware of it. What is happening from the point of view of the OS is that the CPU is suddenly much slower.
All of this make sense and expected given the burstable nature of the system. But what is the observed behavior?
Well, the instance appears to be frozen. All the cloud metrics will tell you that everything is green, but you can’t access the system (no CPU to accept new connections) you can’t SSH into it (same) and if you have an existing SSH connection, it appears to have frozen. Measuring performance from inside the machine shows that everything is cool. One CPU is busy (expected, generating the certificate, doing indexing, etc). Another is idle. But the system behaves as if it has no CPU available, which is exactly what is going on, except in a way that we can’t tell.
RavenDB goes to a lot of trouble to be a nice citizen and a good neighbor. This includes scheduling operations so the underlying OS will always have the required resources to handle additional load. For example, background tasks are run with lowered priority, etc. But when running on a burstable machine that is being throttled… well, from the outside it looked like certain trivial operations would just take the entire machine down and it wouldn’t be recoverable short of hard reboot.
Even when you know what is going on, it doesn’t really help you. Because from inside the machine, there is no way to access the cloud metrics in a good enough precision to take action.
We have a pretty strong desire to not get into these kind of situation, so we implemented what I can only refer to as counter measures. When you are running on a burstable instance, you can let RavenDB know what is your CPU credits situation, at which point RavenDB will actively monitor the machine and compute its own tally of the outstanding CPU credits situation. When we notice that the CPU credits are running short, we’ll start pro-actively halting internal processes to give the machine more space to recover from the CPU credits shortage.
We’ll move ETL processes and ongoing backups to other nodes in the cluster and even pause indexing in order to recover the CPU time we need. Here is an example of what you’ll see in such a case:
One of the nice things about the kind of promises RavenDB make about its indexes is that it is able to make these kind of decisions without impacting the guarantees that we provide.
If the situation is still bad, we’ll start proactively rejecting requests. The idea is that instead of getting of getting to the point where we are being throttled (and effectively down to the world), we’ll process a request by simply sending 503 Service Unavailable response back. This is going to be very cheap to do, so won’t put additional strain on our limited budget. At the same time, the RavenDB’s client treat this kind of error as a trigger for a failover and will use another node to service this request.
This was a pretty long post to explain that RavenDB is going to give you a much nicer experience on burstable machines even if you don’t have bursting capabilities.
A few days ago I talked about how you can use RavenDB’s query functions to compute distances during queries. On the one hand, I’m really happy that you can do that without having to wait for us to update RavenDB, on the other hand, I felt that this should really be us doing this. So I spent some time on spatial this week and we got a whole bunch of nice features out of it.
The first new option is the ability to natively get the distance from a location as part of the query:
You no longer need JS tricks to get this information.
As you can see, I’m just projecting the distance here, not sorting or filtering by it. This can be nice if you need to take into account multiple spatial operations. “Find me the nearest coffee, but also show me how far it is from work”, for example.
The next spatial feature is shown in the following query, and I’m going to be that you wouldn’t notice it if I didn’t mark it up:
What does this do? Well, this tell RavenDB that we want to sort the movies by distance, but to round it up to 5km increments. This, in turn, means that the secondary sort, by Rating, is now much more meaningful.
The output of this query is all a set of movies in that are up to 5 km from me, 5 – 10km , 10 – 15 km, etc. And inside each bucket, the results are sorted based on the rating descending.
This handle the very common issue of users nor caring whatever something is 1.2 or 1.5 km away and wanting to sort by “close, medium, far” and then by other factors as well.
We got a few requests for some guidance on how to optimize RavenDB insert rate. Our current benchmark is standing at 135,000 inserts/sec on a sustained basis, on a machine that cost less than a 1,000$. However, some users tried to write their own benchmarks and got far less (about 50,000 writes / sec). Therefor, this post, in which I’m going to do a bunch of things and see if I can make RavenDB write really fast.
I’m sorry, this is likely to be a long post. I’m going to be writing this as I’m building the benchmark and testing things out. So you’ll get a stream of consciousness. Hopefully it will make sense.
Because of the size of this post, I decided to move most of the code snippets out. I created a repository just for this post, and I’m showing my steps as I go along.
Rules for this post:
- I’m going to use the last stable version of RavenDB (4.2, at the time of writing)
- Commodity hardware is hard to quantify, I’m going to use AWS machines because they are fairly standard metric and likely where you’re going to run it.
- Note that this does mean that we’ll probably have less performance than if we were running on dedicated hardware.
- Another thing to note (and we’ll see later) is that I/O rate on the cloud is… interesting topic.
- No special system setup
- Kernel config
- Reformatting of hard disk
- Changing RavenDB config parameters
The first thing to do is to figure out what we are going to write.
The test machine is: t3a.xlarge with 4 cores, 16 GB RAM. This seemed like a fairly reasonable machine to test with. I’m using Ubuntu 18.04 LTS as the operating system.
The machine has an 8GB drive that I’m using to host RavenDB and a separate volume for the data itself. I create a 512GB gp2 volume (with 1536 IOPS) to start with. Here what this looked like from inside the machine:
I’m including the setup script here for completeness, as you can see, there isn’t really anything here that matters.
Do note that I’m going the quick & dirty mode here without security, this is mostly so I can see what the impact of TLS on the benchmark is at a later point.
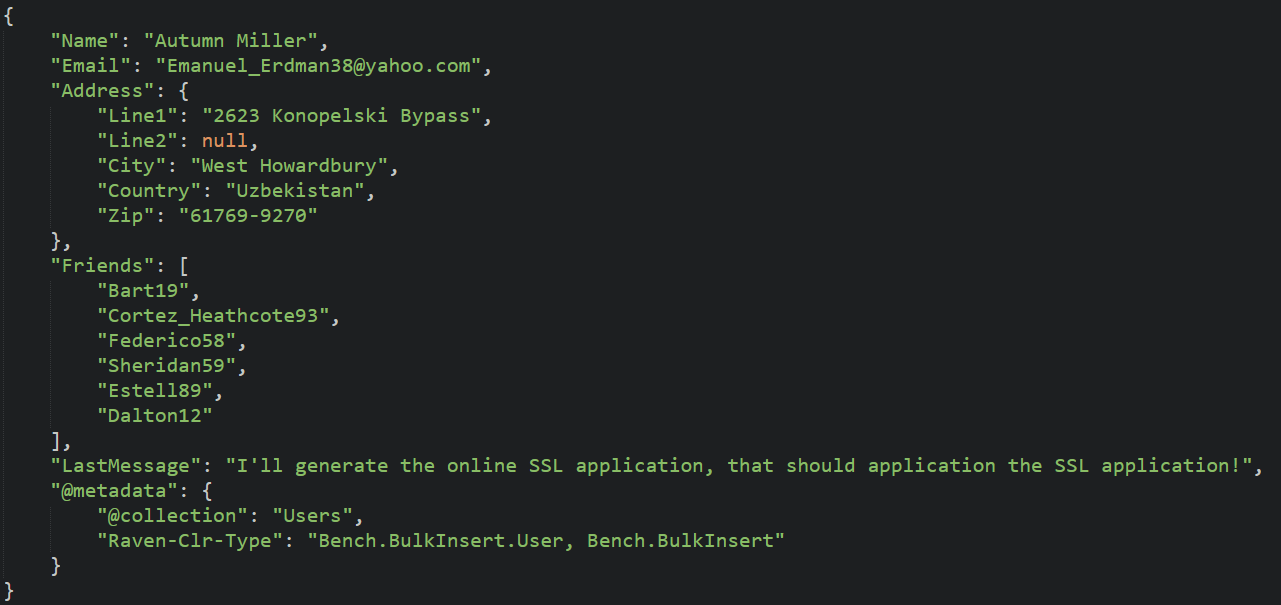
We are now pretty much ready, I think. So let’s take a look at the first version I tried. Writing 100,000 random user documents like the following:
As you can see, that isn’t too big and shouldn’t really be too hard on RavenDB. Unfortunately, I discovered a problem, the write speed was horrible.
Oh wait, the problem exists between keyboard and chair, I was running that from my laptop, so we actually had to go about 10,000 KM from client to server. That… is not a good thing.
Writing the data took almost 12 minutes. But at least this is easy to fix. I setup a couple of client machines on the same AZ and tried again. I’m using spot instances, so I got a t3.large instance and a m5d.large instance.
That gave me a much nicer number, although still far from what I wanted to have.
On the cloud machines, this takes about 23 - 25 seconds. Better than 12 minutes, but nothing to write home about.
One of the reasons that I wanted to write this blog post is specifically to go through this process, because there are a lot of things that matter, and it sometimes can be hard to figure out what does.
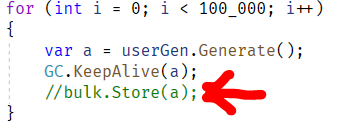
Let’s make a small change in my code, like so:
What this does is to remove the call to RavenDB entirely. The only cost we have here is the cost of generating the from the Bogus library. This time, the code completes in 13 seconds.
But wait, there are no RavenDB calls here, why does it take so long? Well, as it turns out, the fake data generation library has a non trivial cost to it, which impact the whole test. I changed things so that we’ll generate 10,000 users and then use bulk insert to send them over and over again. That means that the time that we measure is just the cost of sending the data over. With these changes, I got much nicer numbers:
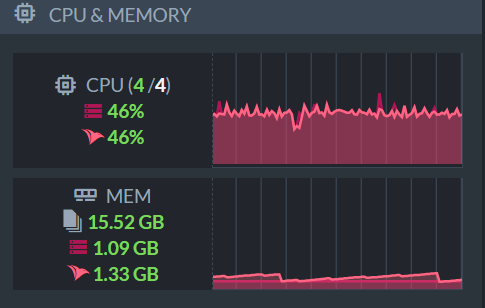
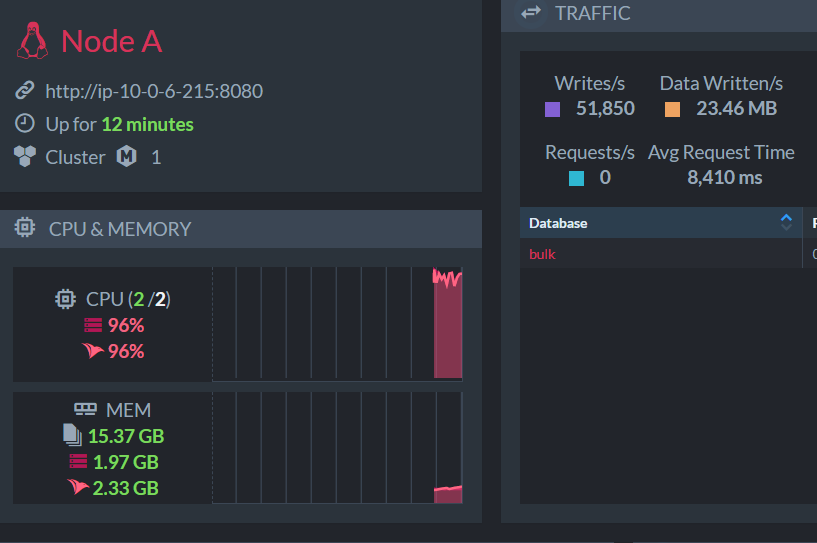
While this is going on, by the way, we have an interesting observation about the node while I’m doing this.
You can see that while we have two machines trying to push data in as fast as them can, we have a lot of spare capacity. This is key, actually. The issue is what the bottleneck, and we already saw that the problem is probably on the client. We improved our performance by over 300% by simply reducing the cost of generating the data, not writing to RavenDB. As it turns out, we are also leaving a lot of performance on the table because we are doing this single threaded. A lot of the time is actually spent on the client side, doing serialization, etc.
I changed the client code to use multiple threads and tried it again. By the way, you might notice that the client code is… brute forced, in a way. I intentionally did everything in the most obvious way possible, caring non at all about the structure of the code. I just want it to work, so no error handling, nothing sophisticated at all here.
This is with both client machines setup to use 4 threads each to send the data. It’s time to dig a bit deeper and see what is actually going on here. The t3.large machine has 2 cores, and looking into what it is doing while it has 4 threads sending data is… instructive…
The m5d.large instance also have two cores, and is in a similar state:
Leaving aside exactly what is going on here (I’ll discuss this in more depth later in this post), it is fairly obvious that the issue here is on the client side, we are completely saturating the machine’s capabilities.
I created another machine to serve as a client, this time a c5.9xlarge, an instance that has 36 cores and is running a much faster CPU that the previous instances. This time, I a single machine and I used just a single thread, and I got the following results:
And at the same time, the server resources utilization was:
Note that this is when we have a single thread doing the work… what happens when we increase the load?
Given the disparity between the client (36 cores) and the server (just 4), I decided to start slow and told the client to use just 12 threads to bulk insert the data. The result:
Now we are talking, but what about the server’s resources?
We got ourselves some spare capacity to throw around, it seems.
At this point, I decided to go all in and see what happens when I’m using all 36 cores for this. As it runs out, we can get faster, which is great, but the rise isn’t linear, unfortunately.
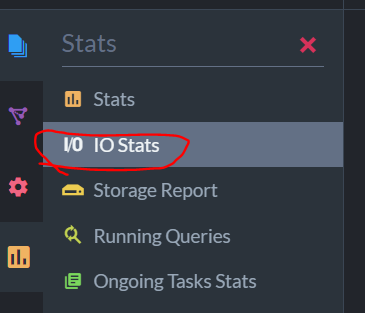
At this point, I mostly hit the limits. Regardless of how much load I put on the client, it wasn’t able to hit any higher than this. I decided to look at what the server is doing. Write speed for RavenDB is almost absolutely determined by the ACID nature of the database, we have to wait for the disk to confirm the write. Because this is such an important factor of our performance, we surface all of that information to you. In the database’s stats page, you can go into the IO Stats section, like so:
The first glace might be a bit confusing, I’ll admit. We tried to pack a lot of data into a single view.
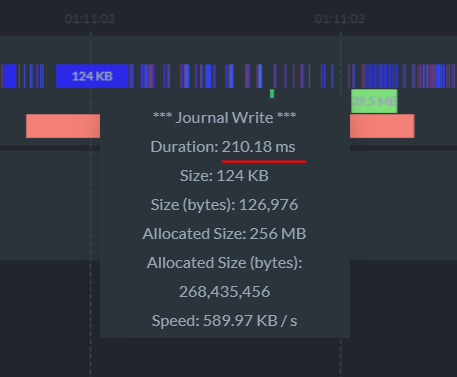
The colors are important. Blue are writes to the journal, which are the thing that would usually hold up the transaction commit. The green (data write / flush) and red (sync) are types of disk operations, and they are shown here to allow you to see if there are any correlation. For example, if you have a big sync operation, it may suck all the I/O bandwidth, and your journal writes will be slow. With this view, you can clearly correlate that information. The brighter the color, the bigger the write, the wider the write, the more time it took. I hope that this is enough to understand the gist of it.
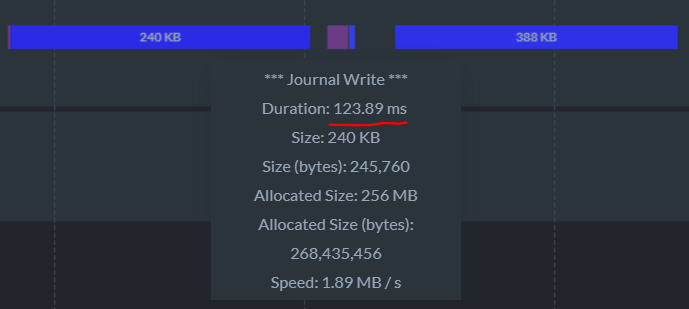
Now, let’s zoom in. Here you can see a single write, for 124KB, that took 200ms.
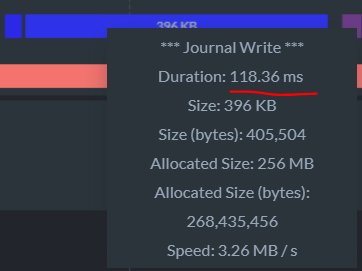
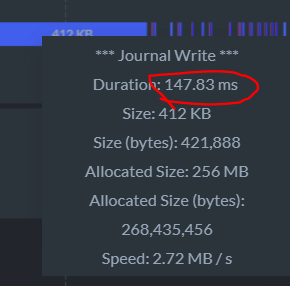
Here is another one:
These are problematic for us, because we are stalling. We can’t really do a lot while we are waiting for the disk (actually, we can, we start processing the next tx, but there is a limit to that as well). That is likely causing us to wait when we read from the network and in likely the culprit. You might have noticed that both slow writes happened in conjunction with the sync (the red square below), that indicate that we might have latency because both operations go to the same location at the same time.
On the other hand, here is another section, where we have two writes very near one another and they both very slow, without a concurrent sync. So the interference from the sync is a theory, not a proven fact.
We can go and change the gp2 drive we have to an io1 drive with provisioned IOPS (1536, same as the gp2). That would cost me 3 times as much, so let’s see if we can avoid this. Journals aren’t meant to be forever. They are used to maintain durability of the data, once we synced the data to disk, we can discard them.
I created an 8 GB io2 drive with 400 IOPS and attached it to the server instance and then set it up:
Here is what this ended up as:
Now, I’m going to setup the journals’ directory for this database to point to the new drive, like so:
And now we have a better separation of the journals and the data, let’s see what this will give us? Not much, it seems, I’m seeing roughly the same performance as before, and the IO stats tells the same story.
Okay, time to see what we can do when we change instance types. As a reminder, so far, my server instance was t3a.xlarge (4 cores, 16 GB). I launched a r5d.large instance (2 cores, 16 GB) and set it up with the same configuration as before.
- 512 GB gp2 (1536 IOPS) for data
- 8GB io2 (400 IOPS) for journals
Here is what I got when I started hammering the machine:
This is interesting, because you can see a few discrepancies:
- The machine feels faster, much faster
- We are now bottleneck on CPU, but note the number of writes per second
- This is when we reduced the number of cores by half!
That seems pretty promising, so I decided to switch instances again. This time to i3en.xlarge instance (4 cores, 30GB, 2 TB NVMe drive). To be honest, I’m mostly interested in the NVMe drive ![]() .
.
Here are the results:
As you can see, we are running pretty smoothly with 90K – 100K writes per second sustained.
On the same i3en.xlarge system, I attached the two volumes (512GB gp2 and 8GB io2) with the same setup (journals on the io2 volume), and I’m getting some really nice numbers as well:
And now, the hour is nearing 4AM, and while I had a lot of fun, I think this is the time to close this post. The factor in write performance for RavenDB is the disk, but we care a lot more about latency than throughput for these kind of operations.
A single t3a.xlarge machine was able to hit peak at 77K writes/second and by changing the instance type and getting better IO, we were able to push that to 100K writes/sec. Our current benchmark is sitting at 138,000 writes/second, by the way, but it isn’t running on virtual machine but on physical hardware. Probably the most important part of that machine is the fact that is has an NVMe drive (latency, again).
However, there is one question that still remains. Why did we have to spend so much compute power on generating the bulk insert operations? We had to hit the server from multiple machines or use 36 concurrent threads just to be able to push enough data so the server will sweat it.
To answer this, I’m going to do the Right Thing and look at the profiler results. The problem is in the client side, so let’s profile the client and see what is taking so much computation horse power. Here are the results:
The cost here is serialization is the major factor here. That is why we need to parallelize the work, otherwise, as we saw, RavenDB is basically going to sit idle.
The reason for this "issue" is that JSON.Net is a powerful library with many features, but it does have a cost. For bulk insert scenarios, you typically have a very well defined set of documents, and you don't need all this power. For this reason, RavenDB exposes an API that allow you to fully control how serialization works for bulk insert:
DocumentStore.Conventions.BulkInsert.TrySerializeEntityToJsonStream
You can use that to significantly speed up your insert processes.
RavenDB has had support for spatial queries for a long time. In RavenDB 4.0 we did a whole bunch of work to make spatial queries better. In particular, we have separate the concepts of searching and ordering for spatial queries. In most cases, if you are doing a spatial query, you’ll want to sort the results by their distance. The classic example is: “Give me the Pizza stores within 5 km from me”. I’ll usually also want to see them listed by their distance. But there are other ways to go about it. For example, if I want to see a concert by Queen, I want to sort them by distance, but I don’t want to do any spatial filtering.
It gets interesting when you combine different spatial operations at the same time. For example, consider the following query. Here is how you can search for a house in a particular school district, but want to find the one that is nearest to the office. The two spatial queries aren’t related at all to one another.
One thing that we did not do, however, was report the distance back to the user. In other words, during the query, we compute the distance to the provided location, but we aren’t actually returning it, just use it for sorting. This is mostly an oversight, and we’ll be fixing that. The thought at the time was that since you already get the document from the server, you already have the location data, and can compute it on the client side. However, that isn’t ergonomic to users, who want to just get the data and be done with it. As I said, we’ll be fixing this, but in the meantime, you can use another of RavenDB’s capabilities to handle this, by define a JS function and projecting that directly from the server.
Let’s take a look at the following query:
This query allows us to project the details we need to render the results table to the user directly, without needing to do anything on the client side. It is a good enough solution for right now, and I’m really happy that RavenDB is flexible enough to provide this to users without us needing to do anything. That said, I don’t like the ergonomics, and we intend to basically make this kind of function into an intrinsic operation inside of RavenDB.
 Recently we got a couple of questions in the mailing list about running a RavenDB 4.x cluster with just two nodes in it. This was a fairly common topology in RavenDB 3.x days, because each of the nodes was mostly independent, but that added a lot of operational complexity to the system. In RavenDB 3.x you had to do a lot of stuff on each of the nodes in the system. RavenDB 4.x has brought us a unified cluster management and greatly simplified a lot of operational tasks. But one of the results of this change is that we now have a cluster rather than just a bunch of nodes.
In particular, in order to be able to operate correctly, a RavenDB cluster needs a majority of the voting nodes to operate successfully. In a typical cluster setup, you are going to have three to five nodes and you’ll need two or three of them to be accessible for the cluster to be healthy.
However, in a cluster of only two nodes, a curious problem arises. The get a majority of the nodes, you need… all the nodes. In other words, if you are running a cluster of just two nodes, and one of them is inaccessible, your cluster is not available.
RavenDB’s distributed nature is built on multiple layers. Even while the cluster itself is not available, you can still load and save documents to the database, perform queries, etc. Most of the normal operations that you would do on a day to day basis will work just fine without the cluster available.
However, management functions require that the cluster be up. These include operations such adding or removing nodes to the cluster, creating or deleting a database, creating an index (including creating an auto index) or using advanced features such as ETL or Subscriptions.
In both of the cases that were raised in the mailing list, we had a two node cluster and one of the nodes was down (VM was shutdown). That led to the inability to remove the down node from the cluster (we have emergency operations that allow that, but they are not meant for normal use) or errors during queries that required us to introduce a new index to the system.
It is important to understand that this isn’t actually an error. This is the system operating as designed and is a predictable (and desirable) part of how it is supposed to work in such failure modes.
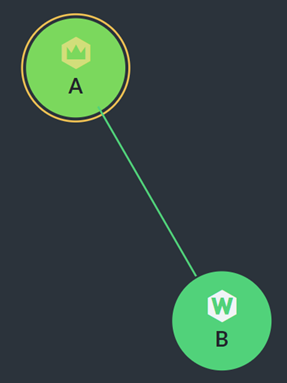
However, that is true only if you are running your cluster with all the nodes as full voting member nodes. There are other alternatives. If you have a two nodes cluster, a single node being down will take the whole cluster down. At this point, you can usually designate one node as the primary and chose a different topology. Look at the cluster image on the right. As you can see, we have the leader A as well as node B. You might notice that node B is marked with a W. Usually a member node in the cluster will be marked with M (for Member). But the W marking stands for Watcher.
In this case, a watcher node is a silent participant in the cluster. It can listen, but doesn’t interfere in the cluster itself. Node A is the sole node in the cluster that can make decisions. So if node B is down, the cluster is still functional. However, if node A is down, node B is going to operate without the cluster. Given that this would be the same situation anyway if you are running with both A and B as full members, that is a net benefit. And from experience, users who want to run a dual node cluster typically already have pretty firm ideas about which of the nodes is the primary.
You can demote a node from a full member to a watcher (and vice versa) dynamically, in the cluster management page in the Studio. However, remember that this is an operation that requires a majority of the cluster to be available.
You can also add a node to the cluster as a watcher immediately, which is probably a better idea.
Aside from not being counted for cluster votes, watcher nodes in RavenDB behave in the exact same manner as other nodes. You can assign them tasks, the cluster manage them as usual, they host databases and in general behave just like any other RavenDB node.
The other use case for watcher nodes are in very large clusters. If your cluster grows being seven nodes, you’ll typically start adding watcher nodes to the cluster, instead of full member nodes. This is to avoid having to get majority vote from a large number of nodes.
 I spoke about this in the video, and it seems to have caught a lot of people yes, so I thought that I would talk here a bit how we trace the root cause of a RavenDB critical issue to a printer being out of paper.
What is the relationship, I can hear you ask, between RavenDB, a document database, and a printer being out of paper? That is a good question. The answer is pretty much none. There is no DocPrint module inside of RavenDB and the last time yours truly wrote printer code was over fifteen years ago. But the story started, like all good tech stories, with a phone call. An inconveniently timed phone call, I might add.
Imagine, the year is 2013, and I’m enjoying the best part of the year, December. I love December for a few reasons. I was born in it, and it is a time where pretty much all our customers are busy doing other stuff and we can focus on pure development. So imagine my surprise when, on the other side of the line, I got a pretty upset admin that had to troubleshoot a RavenDB instance that would refuse to start. To make things interesting, this admin had drawn the short straw, I assume, and had to man the IT department while everyone else was on vacation. He had no relation to RavenDB during normal operations and only had the bare minimum information about it.
The symptoms were clear, luckily. RavenDB would simply refuse to start, hanging almost immediately, it seemed. No network access, nothing in the logs to indicate a problem. Just… hanging…
Here is the stack trace that we captured:
And that was… it. We started to look into it, and we run into this StackOverflow question, which was awesome. Indeed, restarting the print spooler would fix the problem and RavenDB would immediately start running. But I couldn’t leave it like this, and I guess the admin on the other side was kinda bored, because he went along with my investigation.
We now have access to the code (we didn’t in 2013) and can look at exactly what is going on. This comment had me… upset:
The service manager in Windows will consider any service that didn’t finish initialization in 30 seconds to be failed and kill it. You might be putting the things together at this point?
After restarting the print spooler, we were able to start RavenDB, but restarting it cause another failure. Eventually we tracked it down to a network printer that was out of paper (presumably no one in the office to notice / fill it up). My assumption is that the print spooler was holding a register key hostage while making a network call to the printer that would time out because it didn’t have any paper. If at that time you would attempt to use a performance counter, you would hang, and if you are running as service, would be killed.
I’m left with nothing to do but quote Leslie Lamport:
A distributed system is one in which the failure of a computer you didn’t even know existed can render your own computer unusable.
Oh so true.
We ended up ditching performance counters entirely after running into so many issues around them. As of 2017, people were still running into this issue, so I think that was a great decision.


