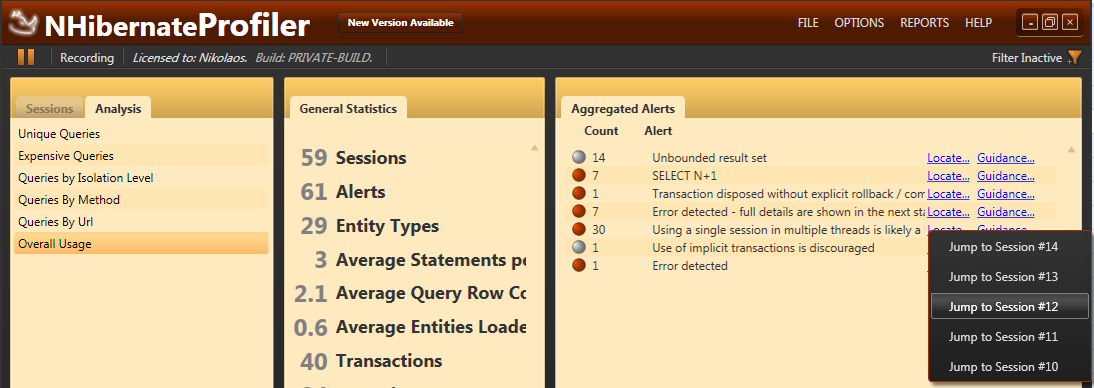
Uber Prof New FeaturesGo To Session from alert
Originally posted at 1/7/2011
This is another oft requested feature that we just implemented. The new feature is available for the full suite of Uber Profilers:
- NHibernate Profiler
- Entity Framework Profiler
- Linq to SQL Profiler
- LLBLGen Profiler
- Hibernate Profiler
You can see the new feature below:
I think it is cute, and was surprisingly easy to do.
Uber Prof have recently passed the stage where it is mostly implemented using itself, so I just had to wire a few things together, and then I spent most of the time just making sure that things aligned correctly on the UI.
More posts in "Uber Prof New Features" series:
- (15 Jan 2011) A better query plan
- (14 Jan 2011) Go To Session from alert


Comments
I was waiting for this feature :)
Plz add auto-scroll list box to show the last item automatically.
Plz add clear/delete sessions/list to the toolbar not right click.
Plz create a multi-tab window for each time we start the new debug from vs.net. it makes tracking much easier.
Thanks for everything.
Not sure if it's possible but I would like to see how many times something was accessed from First Level Cache.
NC,
That isn't really possible.
What scenario do you have in mind where this is actually interesting?
It was just something that came up in discussion today, we have some classes called KPIs which use similar data in order to generate stats and reports. One KPI would be to work out the scheduled cost for an employee to work, while another KPI is to work out the actual cost for an employee, for a week. Both KPI's happen to rely on a Job.
If the job has been loaded already for that request, each other employee doesn't query for that job since its in the first level cache, so 10 employees may happen to have the same job.
We were wondering if its possible to see cache hit counts vs actual queried result counts.
If that makes sense.
It does make sense, but it would truly overload you with details that you usually don't need to see.
You can deduct that info from NOT seeing the query for it.
Hi Ayende, the link to nhprof points to http://nhrpfo.com/
Thanks, fixed
Most of the time we wouldn't need to see those details, you're right. But we were more wanting to ensure that the data was coming from the 1st level cache.
We are working on a legacy application that was started in .NET Beta, and all the data access is a mix of direct sql, table adapters, and a custom rolled data access generator. But we out grew all that, so we are rolling NHibernate to replace all that. (Reduced some sections from 2000+ queries down to like 6/7 with the help of eager loading, and requests from 7 seconds to 0.2)
When looking at the queries in NHProf, sometimes queries are duplicated and it's hard to figure out why. Other queries which we know are being called more than once only show in NHProf once so we know those are from 1st level cache.
So from this we discussed the possibility of seeing what duplicate queries were returning data from 1st level cache.
Comment preview