Every now and then, you run into the sort of bugs that are flat-out impossible to figure out. Recently one of our RavenDB servers started to throw impossible errors. Now, I know what you are going to say, you’ve all seen “impossible” bugs that were very clear in retrospect.
In this case, this is a piece of code that worked tirelessly for over a decade, so it has both tenure and length of service to show that there is no obvious bad stuff there. The relevant failure was in writing RavenDB’s journal files, to give you some context.
That is the sort of thing that has gone through the wringer. That is something that we went over, tested, verified, etc. And suddenly, within the span of a few weeks, we had several separate incidents where journal writing & recovery failed.
We investigated, because that is a Bad Thing. The Emergency Council for Horrible Bugs was convened. The council has over 50 years of cumulative experience in RavenDB. It issued a ruling: that Was Not Supposed To Happen.
Behind the scenes, there were three guys scratching their heads about this. Because it really shouldn’t be possible. The only lead we had was that the errors all happened on the same instance, and that was an ARM machine. RavenDB has been running on ARM for a long time, that isn’t something new.
We scanned the code, we consulted the auguries (Claude), but nothing made sense. Then we tried to reduce the problem to its essential components. Here is what we came up with. A short Python script that can reproduce the problem:
import ctypes, mmap, os, signal
MB =1024*1024defregion(i):
fd = os.memfd_create(f"region{i}")
os.ftruncate(fd,4* MB)
m = mmap.mmap(fd,4* MB)# MAP_SHARED# 2 MB aligned
off =-ctypes.addressof(ctypes.c_char.from_buffer(m))%(2*MB)return fd, m, off
for _ inrange(os.cpu_count()-1):# fork process per coreif os.fork()==0:break
regions =[region(i)for i inrange(16)]
it =0whileTrue:
it +=1for i,(fd, m, off)inenumerate(regions):
m[off:off +16]=b"%2d %13d"%(i, it)# write via mmapfor i,(fd, m, off)inenumerate(regions):
found = os.pread(fd,16, off)# read via file I/Oif found !=b"%2d %13d"%(i, it):print(f"pid {os.getpid()}: "f"wrote {b'%2d %13d'%(i, it)}, "f"but the file holds {found}",
flush=True,)
os.killpg(0, signal.SIGTERM)# stop allfor fd, m, off in regions:# done with the buffer, release the memory
m.madvise(mmap.MADV_DONTNEED, off,2*MB)
If you run this code on a 2-core ARM instance, such as AWS’ c7g.large, you’ll eventually hit a failure.
The code here isn’t complex. We spawn a (separate) process per core, and in each one we create 16 (separate) files and write to them using mmap and then read them via file I/O. Linux explicitly ensures that this is valid, and that both the file I/O and mmap writes will use the same physical memory in the page cache.
Note that after each loop, we discard the memory to free the buffers. Linux doesn’t guarantee what we’ll see after we call this method, but since we read only our own writes, that is fine.
There is no concurrent access to the same data here. We use multiple processes, but they all run on their own data, there are no threads, etc.
You can look at the code above for as long as you like. There is nothing there to see. The problem lies a lot lower than this, in the kernel.
Our original problem, with messed-up journal writes, started when the ARM instance we were running was upgraded to kernel version 7.0.0-1014-aws. That version is affected by CVE-2026-74674, which we encountered on our ARM instance.
The underlying issue is that the kernel messes up page mapping, leading you to write to someone else’s memory. Yes, that includes some other random process, in this case. That is why this is a CVE, and not “just” a bug.
In our case, we can close the chapter on this impossible issue with a pat on the back. Yes, that was Not Our Fault. We’ll reconvene tomorrow for the next bug (which will probably be our fault).
I do want to point out something really interesting here. It took us a very short amount of time to figure out what the problem was when we started to actually look at this. That is solely because of the use of AI. We have experience with handling similar bugs in the past, and the typical time to resolve them was in the order of many weeks. This one was solved within a much shorter time frame, and most of the time was just figuring out where the problem was, so we could look into it.
Today's incident involved a production system failure when one node in the cluster unexpectedly died. That is a scenario RavenDB is designed to handle, and there are well-established (and well-trodden) procedures for recovery.
In this case, the failing node didn’t just crash (which a restart would solve), but actually died. This meant that the admin had to provision a new server and add it to the cluster. This process is, again, both well-established and well-trodden.
As you can tell from the fact that you are reading this post, something went wrong. This cluster is primarily intended to host a single large database (100+ GB in size). When you add a new node to the cluster and add an existing database to it, we need to sync the state between the existing nodes and the new node.
For large databases, that can take a while to complete, which is fine because the new node hasn’t (yet) been promoted to serve users’ requests. It is just slurping all the data until it is in complete sync with the rest of the system. In this case, however… somehow this rookie server got promoted to a full-blown member and started serving user requests.
This is not possible. I repeat, it is not possible. This code has been running in production for over a decade. It has been tested, it has been proven, it has been reviewed, and it has been modeled. And yet… It happened. This sucks.
This postmortem will dissect this distributed systems bug.Debugging such systems is pretty complex and requires specialized expertise. But this particular bug is surprisingly easy to reason about.
Let’s start from the beginning. Here is how the RavenDB cluster decides if a node can be promoted:
defscan_nodes():
states ={}for node in self.cluster.nodes:# retrieve the state of the node (remote call)# - may fail if node is down
state = self.cluster.get_current_state(node)
states[node]= state
for database in self.cluster.databases:
promotables = database.promotable_nodes()iflen(promotables)==0:# nothing to do continuefor promotable in promotables:
mentor = promotable.mentor_node()
mentor_db_state = states[mentor].databases[database.name]if mentor_db_state.faulted:# ignore mentor in faulty statecontinue
promotable_db_state = states[promotable].databases[database.name]if mentor_db_state.last_etag > promotable_db_state.current_etag:continue# the promotable node is up to date as of the last check cycle, promote
self.cluster.promote_node(promotable, database)
The overall structure is pretty simple, we ask each of the nodes in the cluster what its current state is. That gives us an inconsistent view of the system (because we ask different nodes at different times).
To resolve this, we keep both the last and current values. In the code above, you can see that we go over all the promotable nodes and check the current state of each promotable node compared to the last state (from the previous call) of its mentoring node.
The idea is that we can promote a node when its current state is greater than the last state of its mentor (allowing some flexibility for constant writes, etc.).
The code is simple, well-tested, and has been widely deployed for a long time. Staring at this code didn’t tell us anything, it looks like it is supposed to work!
The problem with distributed systems is that there is also all the code involved that is not there. For example, you can see that there is handling here for when the mentor node has failed. In that case, another part of the code would reassign the promotable node to a new mentor, and we’ll start the cycle again.
That was indeed the cause of the problem. Midway through the sync process for the new node, the mentor node failed. That is expected, as I mentioned, and handled. The problem was that there are various levels of failure.
For example, it is very clear that a node that is offline isn’t going to respond to a status request, right?
What about a node that just restarted? It can respond, and for all intents and purposes, it is up & running - except that it is still loading its databases.
Loading a database that exceeds the 100 GB mark can take a while, especially if your disk is taking its time. In that case, what ended up happening was that the status check for the node passed with flying colors, and the status check for the database state returned a loading state.
All the other fields in the database status check were set to their default values…
I think you can see where this is going, right? The problem was that we got a valid status report from a node and didn’t check the status of the individual database state. Then we checked the progress of the promotable database against the mentor state (which was all set to default values).
The promotable node’s current etag was indeed higher than the last etag from the mentor node (since it was the default 0 value), and boom, we have a rookie server being promoted too soon.
The actual fix, by the way, is a single if statement to verify that the state of the database is properly loaded before we check the actual values.
To reproduce this, even after we knew what was going on, was an actual chore, by the way. You need to hit just the right race conditions on two separate machines to get to this state, helped by slow disk, a very large database, and two separate mistimed incidents of server failures.
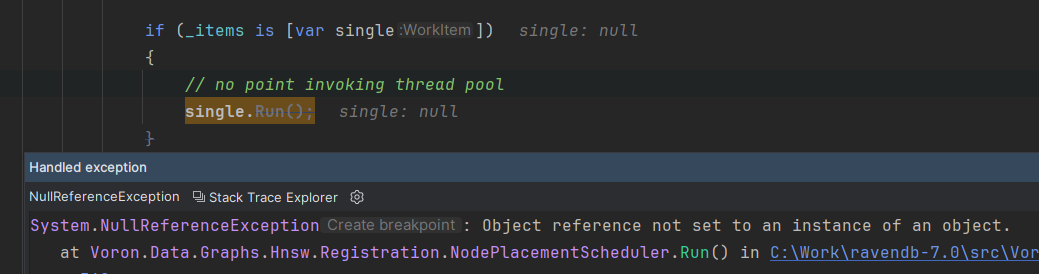
if(_items is [var single]){
// no point invoking thread pool
single.Run();}
And I was very proud of myself for writing such pretty and succinct C# code.
Then I got a runtime error:
I asked Grok about this because I did not expect this, and got the following reply:
No, if (_items is [var single]) in C# does not match a null value. This pattern checks if _items is a single-element array and binds the element to single. If _items is null, the pattern match fails, and the condition evaluates to false.
However, the output clearly disagreed with both Grok’s and my expectations. I decided to put that into SharpLab, which can quickly help identify what is going on behind the scenes for such syntax.
if(strs is [var s])// no null checkif(strs is [string s])// if (s != null)if(strs is [{} s])// if (s != null)
Turns out that there is a distinction between a var pattern (allows null) and a non-var pattern. The third option is the non-null pattern, which does the same thing (but doesn’t require redundant type specification). Usually var vs. type is a readability distinction, but here we have a real difference in behavior.
Note that when I asked the LLM about it, I got the wrong answer. Luckily, I could get a verified answer by just checking the compiler output, and only then head out to the C# spec to see if this is a compiler bug or just a misunderstanding.
There are at least 3 puns in the title of this blog post. I’m sorry, but I’m writing this after several days of tracking an impossible bug. I’m actually writing a set of posts to wind down from this hunt, so you’ll have to suffer through my more prosaic prose.
This bug is the kind that leaves you questioning your sanity after days of pursuit, the kind that I’m sure I’ll look back on and blame for any future grey hair I have. I’m going to have another post talking about the bug since it is such a doozy. In this post, I want to talk about the general approach I take when dealing with something like this.
Beware, this process involves a lot of hair-pulling. I’m saving that for when the real nasties show up.
The bug in question was a race condition that defied easy reproduction. It didn’t show up consistently—sometimes it surfaced, sometimes it didn’t. The only “reliable” way to catch it was by running a full test suite, which took anywhere from 8 to 12 minutes per run. If the suite hung, we knew we had a hit. But that left us with a narrow window to investigate before the test timed out or crashed entirely. To make matters worse, the bug was in new C code called from a .NET application.
New C code is a scary concept. New C code that does multithreading is an even scarier concept. Race conditions there are almost expected, right?
That means that the feedback cycle is long. Any attempt we make to fix it is going to be unreliable - “Did I fix it, or it just didn’t happen?” and there isn’t a lot of information going on.The first challenge was figuring out how to detect the bug reliably.
Using Visual Studio as the debugger was useless here—it only reproduced in release mode, and even with native debugging enabled, Visual Studio wouldn’t show the unmanaged code properly. That left us blind to the C library where the bug resided. I’m fairly certain that there are ways around that, but I was more interested in actually getting things done than fighting the debugger.
We got a lot of experience with WinDbg, a low-level debugger and a real powerhouse. It is also about as friendly as a monkey with a sore tooth and an alcohol addiction. The initial process was all about trying to reproduce the hang and then attach WinDbg to it.
Turns out that we never actually generated PDBs for the C library. So we had to figure out how to generate them, then how to carry them all the way from the build to the NuGet package to the deployment for testing - to maybe reproduce the bug again. Then we could see in what area of the code we are even in.
Getting WinDbg attached is just the start; we need to sift through the hundreds of threads running in the system. That is where we actually started applying the proper process for this.
This piece of code is stupidly simple, but it is sufficient to reduce “what thread should I be looking at” from 1 - 2 minutes to 5 seconds.
I had the thread that was hanging, and I could start inspecting its state. This was a complex piece of code, so I had no idea what was going on or what the cause was. This is when we pulled the next tool from our toolbox.
This isn’t a joke, it is a super important aspect. In WinDbg, we noticed some signs in the data that the code was working on, indicating that something wasn’t right. It didn’t make any sort of sense, but it was there. Here is an example:
enum state
{
red,
yellow,
green
};enum state _currentState;
And when we look at it in the debugger, we get:
0:000> dt _currentState
Local var @ 0x50b431f614 Type state
17 ( banana_split )
That is beyond a bug, that is some truly invalid scenario. But that also meant that I could act on it. I started adding things like this:
The end result of this is that instead of having to wait & guess, I would now:
Be immediately notified when the issue happened.
Inspect the problematic state earlier.
Hopefully glean some additional insight so I can add more of those things.
With this in place, we iterated. Each time we spotted a new behavior hinting at the bug’s imminent trigger, we put another call to the alert function to catch it earlier. It was crude but effective—progressively tightening the noose around the problem.
Race conditions are annoyingly sensitive; any change to the system—like adding debug code—alters its behavior. We hit this hard. For example, we’d set a breakpoint in WinDbg, and the alert function would trigger as expected. The system would beep, we’d break in, and start inspecting the state. But because this was an optimized release build, the debugging experience was a mess. Variables were often optimized away into registers or were outright missing, leaving us to guess what was happening.
Because we are sending a pointer to the work value to the spill function, the compiler cannot just put that in a register and must place it on the stack. That means that it is much easier to inspect it, of course.
Unfortunately, adding those spill calls led to the problem being “fixed”, we could no longer reproduce it. Far more annoyingly, any time that we added any sort of additional code to try to narrow down where this was happening, we had a good chance of either moving the behavior somewhere completely different or masking it completely.
Here are some of our efforts to narrow it down, if you want to see what the gory details look like.
At this stage, the process became a grind. We’d hypothesize about the bug’s root cause, tweak the code, and test again. Each change risked shifting the race condition’s timing, so we’d often see the bug vanish, only to reappear later in a slightly different form. The code quality suffered—spaghetti logic crept in as we layered hacks on top of hacks. But when you’re chasing a bug like this, clean code takes a back seat to results. The goal is to understand the failure, not to win a style award.
Bug hunting at this level is less about elegance and more about pragmatism. As the elusiveness of the bug increases, so does code quality and any other structured approach to your project. The only thing on your mind is, how do I narrow it down?. How do I get this chase to end?
Next time, I’ll dig into the specifics of this particular bug. For now, this is the high-level process: detect, iterate, hack, and repeat. No fluff—just the reality of the chase. The key in any of those bugs that we looked at is to keep narrowing the reproduction to something that you can get in a reasonable amount of time.
Once that happens, when you can hit F5 and get results, this is when you can start actually figuring out what is going on.
This post isn’t actually about a production issue—thankfully, we caught this one during testing. It’s part of a series of blog posts that are probably some of my favorite posts to write. Why? Because when I’m writing one, it means I’ve managed to pin down and solve a nasty problem.
This time, it’s a race condition in RavenDB that took mountains of effort, multiple engineers, and a lot of frustration to resolve.
For the last year or so, I’ve been focused on speeding up RavenDB’s core performance, particularly its IO handling. You might have seen my earlier posts about this effort. One key change we made was switching RavenDB’s IO operations to use IO Ring, a new API designed for high-performance, asynchronous IO, and other goodies. If you’re in the database world and care about squeezing every ounce of performance out of your system, this is the kind of thing that you want to use.
This wasn’t a small tweak. The pull request for this work exceeded 12,000 lines of code—over a hundred commits—and likely a lot more code when you count all the churn. Sadly, this is one of those changes where we can’t just split the work into digestible pieces. Even now, we still have some significant additional work remaining to do.
We had two or three of our best engineers dedicated to it, running benchmarks, tweaking, and testing over the past few months. The goal is simple: make RavenDB faster by any means necessary.
And we succeeded, by a lot (and yes, more on that in a separate post). But speed isn’t enough; it has to be correct too. That’s where things got messy.
Tests That Hang, Sometimes
We noticed that our test suite would occasionally hang with the new code. Big changes like this—ones that touch core system components and take months to implement—often break things. That’s expected, and it’s why we have tests. But these weren’t just failures; sometimes the tests would hang, crash, or exhibit other bizarre behavior. Intermittent issues are the worst. They scream “race condition,” and race conditions are notoriously hard to track down.
Here’s the setup. IO Ring isn’t available in managed code, so we had to write native C code to integrate it. RavenDB already has a Platform Abstraction Layer (PAL) to handle differences between Windows, Linux, and macOS, so we had a natural place to slot this in.
The IO Ring code had to be multithreaded and thread-safe. I’ve been writing system-level code for over 20 years, and I still get uneasy about writing new multithreaded C code. It’s a minefield. But the performance we could get… so we pushed forward… and now we had to see where that led us.
Of course, there was a race condition. The actual implementation was under 400 lines of C code—deliberately simple, stupidly obvious, and easy to review. The goal was to minimize complexity: handle queuing, dispatch data, and get out. I wanted something I could look at and say, “Yes, this is correct.” I absolutely thought that I had it covered.
We ran the test suite repeatedly. Sometimes it passed; sometimes it hung; rarely, it would crash.
When we looked into it, we were usually stuck on submitting work to the IO Ring. Somehow, we ended up in a state where we pushed data in and never got called back. Here is what this looked like.
0:019> k
# Call Site00 ntdll!ZwSubmitIoRing
01KERNELBASE!ioring_impl::um_io_ring::Submit+0x7302KERNELBASE!SubmitIoRing+0x3b03 librvnpal!do_ring_work+0x16c04KERNEL32!BaseThreadInitThunk+0x1705 ntdll!RtlUserThreadStart+0x2c
In the previous code sample, we just get the work and mark it as done. Now, here is the other side, where we submit the work to the worker thread.
We basically take each page we were asked to write and send it to the worker thread for processing, then we wait for the worker to mark all the requests as completed. Note that we play a nice game with the prev and next pointers. The next pointer is used by the worker thread while the prev pointer is used by the submitter thread.
You can also see that this is being protected by a critical section (a lock) and that there are clear hand-off segments. Either I own the memory, or I explicitly give it to the background thread and wait until the background thread tells me it is done. There is no place for memory corruption. And yet, we could clearly get it to fail.
Being able to have a small reproduction meant that we could start making changes and see whether it affected the outcome. With nothing else to look at, we checked this function:
I have written similar code dozens of times, I very intentionally made the code simple so it would be obviously correct. But when I even slightly tweaked the queue_work function, the issue vanished. That wasn’t good enough, I needed to know what was going on.
Here is the “fixed” version of the queue_work function:
This is functionally the same thing. Look at those two functions! There shouldn’t be a difference between them. I pulled up the assembly output for those functions and stared at it for a long while.
A total of ten lines of assembly. Here is what is going on:
Line 5 - we read the IoRing.head into register rax (representing cur_head).
Line 6 - we write the rax register (representing cur_head) to work->next.
Line 7 - we compare-exchange the value of IoRing.head with the value in rcx (work) using rax (cur_head) as the comparand.
Line 8 - if we fail to update, we jump to line 5 again and re-try.
That is about as simple a code as you can get, and exactly expresses the intent in the C code. However, if I’m looking at the original version, we have:
This looks mostly the same, right? But notice that we have just a few more lines. In particular, lines 7, 9, and 10 are new. Because we are using a field, we cannot compare to cur_head directly like we previously did but need to read work->next again on lines 9 &10. That is fine.
What is not fine is line 7. Here we are reading IoRing.headagain, and work->next may point to another value. In other words, if I were to decompile this function, I would have:
This smells like a compiler bug. I also checked the assembly output of clang, and it doesn’t have this behavior.
I opened a feedback item with MSVC to confirm, but the evidence is compelling. Take a look at this slightly different version of the original. Instead of using a global variable in this function, I’m passing the pointer to it.
That unexpected load was breaking our thread-safety assumptions, and that led to a whole mess of trouble. Violated invariants are no joke.
The actual fix was pretty simple, as you can see. Finding it was a huge hurdle. The good news is that I got really familiar with this code, to the point that I got some good ideas on how to improve it further 🙂.
I’m trying to reason about the behavior of this code, and I can’t decide if this is a stroke of genius or if I’m suffering from a stroke. Take a look at the code, and then I’ll discuss what I’m trying to do below:
The idea is pretty simple, I’m opening the same file twice. Once in buffered mode and mapping that memory for both reads & writes. The problem is that to flush the data to disk, I have to either wait for the OS, or call FlushViewOfFile() and FlushFileBuffers() to actually flush it to disk explicitly.
The problem with this approach is that FlushFileBuffers() has undesirable side effects. So I’m opening the file again, this time for unbuffered I/O. I’m writing to the memory map and then using the same mapping to write to the file itself. On Windows, that goes through a separate path (and may lose coherence with the memory map).
The idea here is that since I’m writing from the same location, I can’t lose coherence. I either get the value from the file or from the memory map, and they are both the same. At least, that is what I hope will happen.
For the purpose of discussion, I can ensure that there is no one else writing to this file while I’m abusing the system in this manner. What do you think Windows will do in this case?
I believe that when I’m writing using unbuffered I/O in this manner, I’m forcing the OS to drop the mapping and refresh from the disk. That is likely the reason why it may lose coherence, because there may be already reads that aren’t served from main memory, or something like that.
This isn’t an approach that I would actually take for production usage, but it is a damn interesting thing to speculate on. If you have any idea what will actually happen, I would love to have your input.
I would really love to have a better understanding of what is going on here!
If you format a 32 MB disk using NTFS, you’ll get the following result:
So about 10 MB are taken for NTFS metadata. I guess that makes sense, and giving up 10 MB isn’t generally a big deal these days, so I wouldn’t worry about it.
I write a 20 MB file and punch a hole in it between 6 MB and 18 MB (12 MB in total), so we have:
And in terms of disk space, we have:
The numbers match, awesome! Let’s create a new 12 MB file, like so:
And the disk is:
And now I’m running the following code, which maps the first file (with the hole punched in it) and writes 4 MB to it using memory-mapped I/O:
HANDLE hMapFile = CreateFileMapping(hFile, NULL, PAGE_READWRITE, 0, 0, NULL);if(hMapFile == NULL){
fprintf(stderr, "Could not create file mapping object: %x\n", GetLastError());
exit(__LINE__);}
char* lpMapAddress = MapViewOfFile(hMapFile, FILE_MAP_WRITE, 0, 0, 0);if(lpMapAddress == NULL){
fprintf(stderr, "Could not map view of file: %x\n", GetLastError());
exit(__LINE__);}for(i =6 * MB; i <10 * MB; i++){((char*)lpMapAddress)[i]++;
}
if (!FlushViewOfFile(lpMapAddress,0)){
fprintf(stderr, "Could not flush view of file: %x\n", GetLastError());
exit(__LINE__);}if(!FlushFileBuffers(hFile)){
fprintf(stderr, "Could not flush file buffers: %x\n", GetLastError());
exit(__LINE__);}
The end for this file is:
So with the other file, we have a total of 24 MB in use on a 32 MB disk. And here is the state of the disk itself:
The problem is that there used to be 9.78 MB that were busy when we had a newly formatted disk. And now we are using at least some of that disk space for storing file data somehow.
I’m getting the same behavior when I use normal file I/O:
moveAmount.QuadPart =6 * MB;
SetFilePointerEx(hFile, moveAmount, NULL, FILE_BEGIN);for(i =6; i <10; i++){if(!WriteFile(hFile, buffer, MB, &bytesWritten, NULL)){
fprintf(stderr, "WriteFile failed on iteration %d: %x\n", i, GetLastError());
exit(__LINE__);}}
So somehow in this sequence of operations, we get more disk space. On the other hand, if I try to write just 22 MB into a single file, it fails. See:
hFile = CreateFileA("R:/original_file.bin", GENERIC_READ | GENERIC_WRITE, 0, NULL, CREATE_ALWAYS, FILE_ATTRIBUTE_NORMAL, NULL);if(hFile == INVALID_HANDLE_VALUE){
printf("Error creating file: %d\n", GetLastError());
exit(__LINE__);}for(int i =0; i <22; i++){if(!WriteFile(hFile, buffer, MB, &bytesWritten, NULL)){
fprintf(stderr, "WriteFile failed on iteration %d: %x\n", i, GetLastError());
exit(__LINE__);}}
You can find the full source here. I would love to understand what exactly is happening and how we suddenly get more disk space usage in this scenario.
Today I set out to figure out an answer to a very specific question. What happens at the OS level when you try to allocate disk space for a sparse file and there is no additional disk space?
Sparse files are a fairly advanced feature of file systems. They allow you to define a file whose size is 10GB, but that only takes 2GB of actual disk space. The rest is sparse (takes no disk space and on read will return just zeroes). The OS will automatically allocate additional disk space for you if you write to the sparse ranges.
This leads to an interesting question, what happens when you write to a sparse file if there is no additional disk space?
Let’s look at the problem on Linux first. We define a RAM disk with 32MB, like so:
As expected, this code will fail on the 5th write (since there is no disk space to allocate in the disk). The error would be:
Write error: errno = 28 (No space left on device)
Here is what the file system reports:
$ du -h /mnt/ramdisk/*4.0M /mnt/ramdisk/anotherfile
28M /mnt/ramdisk/fullfile
$ ll -h /mnt/ramdisk/
total 33M
drwxrwxrwt 2 root root 80 Jan 910:43./
drwxr-xr-x 6 root root 4.0K Jan 910:30../-rw-r--r--1 ayende ayende 4.0M Jan 910:43 anotherfile
-rw-r--r--1 ayende ayende 32M Jan 910:43 fullfile
As you can see, we have a total of 32 MB of actual size reported, but ll is reporting that we actually have files bigger than that (because we have hole punching).
What would happen if we were to run this using memory-mapped I/O? Here is the code:
This will lead to an interesting scenario. We need to allocate disk space for the memory, and we’ll do so (note that we are writing into the hole), and this code will fail with a segmentation fault.
It will fail in the loop, by the way, as part of the page fault to bring the memory in, the file system needs to allocate the disk space. If there is no such disk space, it will fail. The only way for the OS to behave in this case is to fail the write, which leads to a segmentation fault.
I also tried that on Windows. I defined a virtual disk like so:
This creates a 32MB disk and assigns it the letter R. Note that we are using NTFS, which has its own metadata, we have roughly 21MB or so of usable disk space to play with here.
Here is the Windows code that simulates the same behavior as the Linux code above:
#include <stdio.h>#include <windows.h>#define MB (1024 * 1024)
int main(){
HANDLE hFile, hFile2;
DWORD bytesWritten;
LARGE_INTEGER fileSize, moveAmount;
char* buffer = malloc(MB);
int i;
DeleteFileA("R:\\original_file.bin");
DeleteFileA("R:\\another_file.bin");
hFile = CreateFileA("R:/original_file.bin", GENERIC_READ | GENERIC_WRITE, 0, NULL, CREATE_ALWAYS, FILE_ATTRIBUTE_NORMAL, NULL);if(hFile == INVALID_HANDLE_VALUE){
printf("Error creating file: %d\n", GetLastError());
exit(__LINE__);}for(int i =0; i <20; i++){if(!WriteFile(hFile, buffer, MB, &bytesWritten, NULL)){
fprintf(stderr, "WriteFile failed on iteration %d: %x\n", i, GetLastError());
exit(__LINE__);}if(bytesWritten != MB){
fprintf(stderr, "Failed to write full buffer on iteration %d\n", i);
exit(__LINE__);}}
FILE_ZERO_DATA_INFORMATION zeroDataInfo;
zeroDataInfo.FileOffset.QuadPart =6 * MB;
zeroDataInfo.BeyondFinalZero.QuadPart =18 * MB;if(!DeviceIoControl(hFile, FSCTL_SET_SPARSE, NULL, 0, NULL, 0, NULL, NULL)||!DeviceIoControl(hFile, FSCTL_SET_ZERO_DATA, &zeroDataInfo, sizeof(zeroDataInfo), NULL, 0, NULL, NULL)){
printf("Error setting zero data: %d\n", GetLastError());
exit(__LINE__);}
// Create another file of size 4 MB
hFile2 = CreateFileA("R:/another_file.bin", GENERIC_READ | GENERIC_WRITE, 0, NULL, CREATE_ALWAYS, FILE_ATTRIBUTE_NORMAL, NULL);if(hFile2 == INVALID_HANDLE_VALUE){
printf("Error creating second file: %d\n", GetLastError());
exit(__LINE__);}for(int i =0; i <4; i++){if(!WriteFile(hFile2, buffer, MB, &bytesWritten, NULL)){
fprintf(stderr, "WriteFile 2 failed on iteration %d: %x\n", i, GetLastError());
exit(__LINE__);}if(bytesWritten != MB){
fprintf(stderr, "Failed to write full buffer 2 on iteration %d\n", i);
exit(__LINE__);}}
moveAmount.QuadPart =12 * MB;
SetFilePointerEx(hFile, moveAmount, NULL, FILE_BEGIN);for(i =0; i <8; i++){if(!WriteFile(hFile, buffer, MB, &bytesWritten, NULL)){
printf("Error writing to file: %d\n", GetLastError());
exit(__LINE__);}}return0;}
And that gives us the exact same behavior as in Linux. One of these writes will fail because there is no more disk space for it. What about when we use memory-mapped I/O?
I didn’t bother checking Mac or BSD, but I’m assuming that they behave in the same manner. I can’t conceive of anything else that they could reasonably do.
RavenDB is a database, a transactional one. This means that we have to reach the disk and wait for it to complete persisting the data to stable storage before we can confirm a transaction commit. That represents a major challenge for ensuring high performance because disks are slow.
I’m talking about disks, which can be rate-limited cloud disks, HDD, SSDs, or even NVMe. From the perspective of the database, all of them are slow. RavenDB spends a lot of time and effort making the system run fast, even though the disk is slow.
An interesting problem we routinely encounter is that our test suite would literally cause disks to fail because we stress them beyond warranty limits. We actually keep a couple of those around, drives that have been stressed to the breaking point, because it lets us test unusual I/O patterns.
We recently ran into strange benchmark results, and during the investigation, we realized we are actually running on one of those burnt-out drives. Here is what the performance looks like when writing 100K documents as fast as we can (10 active threads):
As you can see, there is a huge variance in the results. To understand exactly why, we need to dig a bit deeper into how RavenDB handles I/O. You can observe this in the I/O Stats tab in the RavenDB Studio:
There are actually three separate (and concurrent) sets of I/O operations that RavenDB uses:
Blue - journal writes - unbuffered direct I/O - in the critical path for transaction performance because this is how RavenDB ensures that the D(urability) in ACID is maintained.
Green - flushes - where RavenDB writes the modified data to the data file (until the flush, the modifications are kept in scratch buffers).
Red - sync - forcing the data to reside in a persistent medium using fsync().
The writes to the journal (blue) are the most important ones for performance, since we must wait for them to complete successfully before we can acknowledge that the transaction was committed. The other two ensure that the data actually reached the file and that we have safely stored it.
It turns out that there is an interesting interaction between those three types. Both flushes (green) and syncs (red) can run concurrently with journal writes. But on bad disks, we may end up saturating the entire I/O bandwidth for the journal writes while we are flushing or syncing.
In other words, the background work will impact the system performance. That only happens when you reach the physical limits of the hardware, but it is actually quite common when running in the cloud.
To handle this scenario, RavenDB does a number of what I can only describe as shenanigans. Conceptually, here is how RavenDB works:
deftxn_merger(self):while self._running:with self.open_tx()as tx:while tx.total_size < MAX_TX_SIZE and tx.time < MAX_TX_TIME:
curOp = self._operations.take()if curOp isNone:break# no more operations
curOp.exec(tx)
tx.commit()# here we notify the operations that we are done
tx.notify_ops_completed()
The idea is that you submit the operation for the transaction merger, which can significantly improve the performance by merging multiple operations into a single disk write. The actual operations wait to be notified (which happens after the transaction successfully commits).
If you want to know more about this, I have a full blog post on the topic. There is a lot of code to handle all sorts of edge cases, but that is basically the story.
Notice that processing a transaction is actually composed of two steps. First, there is the execution of the transaction operations (which reside in the _operations queue), and then there is the actual commit(), where we write to the disk. It is the commit portion that takes a lot of time.
Here is what the timeline will look like in this model:
We execute the transaction, then wait for the disk. This means that we are unable to saturate either the disk or the CPU. That is a waste.
To address that, RavenDB supports async commits (sometimes called early lock release). The idea is that while we are committing the previous transaction, we execute the next one. The code for that is something like this:
deftxn_merger(self):
prev_txn = completed_txn()while self._running:
executedOps =[]with self.open_tx()as tx:while tx.total_size < MAX_TX_SIZE and tx.time < MAX_TX_TIME:
curOp = self._operations.take()if curOp isNone:break# no more operations
executedOps.append(curOp)
curOp.exec(tx)if prev_txn.completed:break# verify success of previous commit
prev_txn.end_commit()# only here we notify the operations that we are done
prev_txn.notify_ops_completed()# start the commit in async manner
prev_txn = tx.begin_commit()
The idea is that we start writing to the disk, and while that is happening, we are already processing the operations in the next transaction. In other words, this allows both writing to the disk and executing the transaction operations to happen concurrently. Here is what this looks like:
This change has a huge impact on overall performance. Especially because it can smooth out a slow disk by allowing us to process the operations in the transactions while waiting for the disk. I wrote about this as well in the past.
So far, so good, this is how RavenDB has behaved for about a decade or so. So what is the performance optimization?
This deserves an explanation. What this piece of code does is determine whether the transaction would complete in a synchronous or asynchronous manner. It used to do that based on whether there were more operations to process in the queue. If we completed a transaction and needed to decide if to complete it asynchronously, we would check if there are additional operations in the queue (currentOperationsCount).
The change modifies the logic so that we complete in an async manner if we executed any operation. The change is minor but has a really important effect on the system. The idea is that if we are going to write to the disk (since we have operations to commit), we’ll always complete in an async manner, even if there are no more operations in the queue.
The change is that the next operation will start processing immediately, instead of waiting for the commit to complete and only then starting to process. It is such a small change, but it had a huge impact on the system performance.
Here you can see the effect of this change when writing 100K docs with 10 threads. We tested it on both a good disk and a bad one, and the results are really interesting.
The bad disk chokes when we push a lot of data through it (gray line), and you can see it struggling to pick up. On the same disk, using the async version (yellow line), you can see it still struggles (because eventually, you need to hit the disk), but it is able to sustain much higher numbers and complete far more quickly (the yellow line ends before the gray one).
On the good disk, which is able to sustain the entire load, we are still seeing an improvement (Blue is the new version, Orange is the old one). We aren’t sure yet why the initial stage is slower (maybe just because this is the first test we ran), but even with the slower start, it was able to complete more quickly because its throughput is higher.
In RavenDB, we really care about performance. That means that our typical code does not follow idiomatic C# code. Instead, we make use of everything that the framework and the language give us to eke out that additional push for performance. Recently we ran into a bug that was quite puzzling. Here is a simple reproduction of the problem:
usingSystem.Runtime.InteropServices;var counts =newDictionary<int,int>();var totalKey =10_000;refvar total =ref CollectionsMarshal.GetValueRefOrAddDefault(
counts, totalKey,out _);for(int i =0; i <4; i++){var key = i %32;refvar count =ref CollectionsMarshal.GetValueRefOrAddDefault(
counts, key,out _);
count++;
total++;}
Console.WriteLine(counts[totalKey]);
What would you expect this code to output? We are using two important features of C# here:
Value types (in this case, an int, but the real scenario was with a struct)
CollectionMarshal.GetValueRefOrAddDefault()
The latter method is a way to avoid performing two lookups in the dictionary to get the value if it exists and then add or modify it.
If you run the code above, it will output the number 2.
That is not expected, but when I sat down and thought about it, it made sense.
We are keeping track of the reference to a value in the dictionary, and we are mutating the dictionary.
The documentation for the method very clearly explains that this is a Bad Idea. It is an easy mistake to make, but still a mistake. The challenge here is figuring out why this is happening. Can you give it a minute of thought and see if you can figure it out?
A dictionary is basically an array that you access using an index (computed via a hash function), that is all. So if we strip everything away, the code above can be seen as:
var buffer =newint[2];
ref var total = ref var buffer[0];
We simply have a reference to the first element in the array, that’s what this does behind the scenes. And when we insert items into the dictionary, we may need to allocate a bigger backing array for it, so this becomes:
var buffer =newint[2];
ref var total = ref var buffer[0];var newBuffer =newint[4];
buffer.CopyTo(newBuffer);
buffer = newBuffer;
total =1;var newTotal = buffer[0]
In other words, the total variable is pointing to the first element in the two-element array, but we allocated a new array (and copied all the values). That is the reason why the code above gives the wrong result. Makes perfect sense, and yet, was quite puzzling to figure out.




 +972 52-548-6969