Oren Eini

CEO of RavenDB

a NoSQL Open Source Document Database

Get in touch with me:

oren@ravendb.net +972 52-548-6969

Posts: 7,546
|
Comments: 51,161
Privacy Policy · Terms
filter by tags archive
time to read 1 min | 171 words

The following code is something that we ran into yesterday, under some conditions, this code will fail with a stack overflow. More specifically, the process crashes and the return code is –1073740791 (or as it is usually presented: 0xC0000409.

At this point in my career I can look at that error code and just recall that this is the Windows error code for a stack overflow, to be more precise, this is: STATUS_STACK_BUFFER_OVERRUN

That… makes sense, I guess, this is a recursive code, after all. Let’s take a look:

Except, that this code explicitly protects against this. Note the call to:

RuntimeHelpers.EnsureSufficientExecutionStack();

In other words, if we are about the run out of stack space, we ask the .NET framework to throw (just before we run out, basically).

This code doesn’t fail often, and we tried to push deeply nested structure through that, and we got an InsufficientExecutionStackException thrown.

Sometimes, however, when we run this code with a relatively flat structure (2 – 4 levels), it will just die with this error.

Can you spot the bug?

time to read 5 min | 932 words

One of the high costs that we have right now in my Redis Clone is strings. That is actually a bit misleading, take a look here:

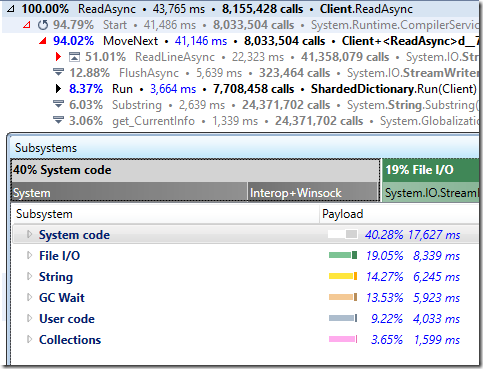
image

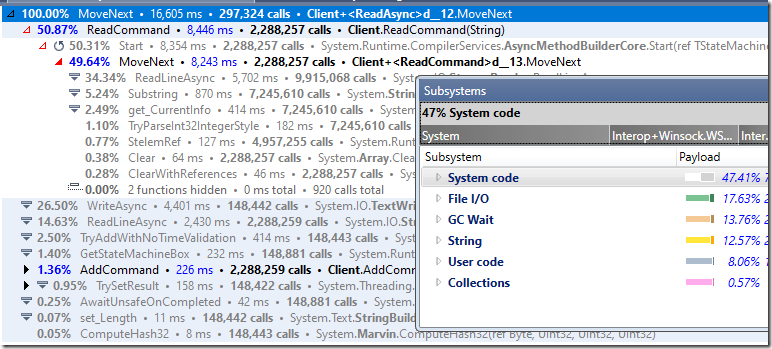
Strings take 12.57% of the runtime, but there is also the GC Wait, where we need to cleanup after them. That means that the manner in which we are working is pretty inefficient.

Our test scenario right now also involves solely GET and SET requests, there are no deletions, expirations, etc. I mention that because we need to consider what we’ll replace the strings with.

The simplest option is to replace that with a byte array, but that is still managed memory and incurs the costs associated with GC. We can pool those byte arrays, but then we have an important question to answer, how do we know when a buffer is no longer used?

Consider the following set of events:

Time Thread #1 Thread #2
1 SET abc  
2   GET abc
3 SET abc  
4   Use the buffer we got on #2

In this case, we have thread #2 accessing the value buffer, but we replaced that buffer. We need to let thread #2 keep using this buffer until it is done.

This little tidbit put us right back at concurrent manual memory management, which is scary. We can do things in a slightly different manner, however. We can take advantage of the GC to support us, like so:

The idea is pretty simple. We have a class that holds a buffer, and when the GC notices that it is no longer in use, it will add its buffer back to the pool. The idea is that we rely on the GC to resolve this (really hard) problem for us. The fact that this moves the cost to the finalizer means that we can not worry about this. Otherwise, you have to jump through a lot of hoops.

The ReusableBuffer class also implements GetHashCode() / Equals() which allow us to use it as a key in the dictionary.

Now that we have the backing store for keys and values, let’s see how we can read & write from the network. I’m going to go back to the ConcurrentDictionary implementation for now, so I’ll handle only a single concept at a time.

Before, we used StreamReader / StreamWriter to do the work, now we’ll use PipeReader / PipeWriter from System.IO.PIpelines. That will allow us to easily work with the raw bytes directly and it is meant for high performance scenarios.

I wrote the code twice, once using the reusable buffer model and once using PIpeReader / PipeWriter and allocating strings. I was surprised to see that my fancy reusable buffers were within 1% performance of the (much simpler) strings implementation. That is 1% in the wrong direction, by the way.

On my machine, the buffer based system was 165K ops/second while the strings based one was 166K ops/sec.

Here is the reusable buffer based approach complete source code. And to compare, here is the string based one. The string based one is about 50% shorter in terms of lines of code.

I’m guessing that the allocation pattern is really good for the kind of heuristics that the GC does. We either have long term objects (in the cache) or very short term ones.

It’s worth pointing out that the actual parsing of the commands from the network isn’t using strings. Only the actual keys and values are actually translated to strings. The rest I’m doing using raw bytes.

Here is what the code looks like for the string version under the profiler:

image

And here is the same thing using the reusable buffer:

image

There are a few interesting things to note here. The cost of ExecCommand is almost twice as high as the previous attempt. Digging deeper, I believe that the fault is here:

This is the piece of code that is responsible for setting an item in the dictionary. However, note that we are doing a read for every write? The idea here is that if we have a set on an existing item, we can avoid allocating the buffer for the key again, and reuse it.

However, that piece of code is in the critical path for this benchmark and it is quite costly. I changed it to do the allocations always, and we got a fairly consistent 1% – 3% faster than the string version. Here is what this looks like:

image

In other words, here is the current performance table (under the profiler):

  • 1.57 ms  - String based 
  • 1.79 ms - Reusable buffer based (reduce memory usage)
  • 1.04 ms - Reusable buffer (optimized lookup)

All of those numbers are under the profiler, and on my development machine. Let’s see what we get when I’m running them on the production instances, shall we?

  • String based – 1,602,728.75 ops/sec
  • Reusable buffer (with reducing memory code) – 1,866,676.53 ops/sec
  • Reusable buffer (optimized lookup) – 1,756,930.64

Those results do not match with what we see in my development machine. The likely reason is that the amount of operations is high enough and the load is sufficiently big that we are seeing a much bigger impact from the memory optimization at scale.

That is the only conclusion I can draw from the fact that the memory reduction code, which adds costs, is actually able to process more requests/seconds under such load.

time to read 4 min | 753 words

Now that I’m done with the low hanging fruits, I decided to shift the Redis implementation to use System.IO.Pipelines. That is a high performance I/O API that is meant specifically for servers that need to eke out all the performance out of the system.

The API is a bit different, but it follows a very logical pattern and makes a lot of sense. Here is the main loop of handling commands from a client:

The idea is that we get a buffer from the network, we read everything (including pipelined commands) and then we flush to the client. The more interesting things happen when we start processing the actual commands, because now we aren’t utilizing StreamReader but PipeReader. So we are working at the level of bytes, not strings.

Here is what this (roughly) looks like, I’m not showing the whole thing because I want to focus on the issue that I ran into:

The code is reading from the buffer, parsing the Redis format and then executing the commands. It supports multiple commands in the same buffer (pipelining) and it has absolutely atrocious performance.

Yes, the super speedy API that is significantly harder to get right (compared to the ease of working with strings) is far slower. And by far slower I mean the following, on my development machine:

  • The previous version clocks at around 126,017.72 operations per second.
  • This version clocks at less than 100 operations per second.

Yes, you read that right, less than one hundred operations per second compared to over hundred thousands for the unoptimized version.

That was… surprising, as you can imagine.

I actually wrote the implementation twice, using different approaches, trying to figure out what I was doing wrong. Surely, it can’t be that bad.

I took a look at the profiler output, to try to figure out what is going on:

image

It says, quite clearly, that the implementation is super bad, no? Except, that this is what you are supposed to be using. So what is going on?

The underlying problem is actually fairly simple and relates to how the Pipelines API achieves its performance. Instead of doing small calls, you are expected to get a buffer and process that. Once you are done processing the buffer you can indicate what amount of data you consumed, and then you can issue another call.

However, there is a difference between consumed data and examined data. Consider the following data:

*3
$3
SET
$15
memtier-2818567
$256
xxxxxxxxxx ... xxxxxx
*2
$3
GET
$15
memtier-7689405
*2
$3
GET
$15
memt

What you can see here is a pipelined command, with 335 bytes in the buffer.  We’ll process all of those commands in a single hit, except… look at the highlighted portion. What do we have there?

We have a partial command. In other words, we are expected to execute a GET with a key size of 15 bytes, but we only have the first 4 bytes here. That is actually expected and fine. We consumed all the bytes until the highlighted portion (thus letting the PipeReader know that we are done with them). The problem is that when we issue a call now, we’ll get the highlighted portion (which we didn’t consume), but we aren’t ready to process that. Data is missing. We indicate that to the PipeReader using the examined portion. So the PipeReader knows that it needs to read more from the network.

However… my code has a subtle bug. It will report that it examined the yellow highlight, not the green one. In other words, we tell the PipeReader that we consumed some portion of the buffer, and examined some more, but there are still bytes on the buffer that are neither consumed nor examined. That means that when we issue the read call, expecting to get data from the network, we’ll actually get the same buffer again, to do the exact same processing.

Eventually, we’ll have more data in the buffer from the other side, so the correctness of the solution isn’t impacted. But it will kill your performance.

The fix is really simple, we need to tell the PipeReader that we examined the entire buffer, so it will not do a busy wait and wait for more data from the network. Here is the bug fix:

With that change in place, we can hit 187,104.21 operations per second! That is 50% better, which is awesome. I haven’t profiled things yet properly, because I also want to address another issue, how are we going to deal with the data from the network. More on that in my next post.

time to read 3 min | 451 words

imageI’m inordinately fond of the Fallacies of Distributed Computing, these are a set of common (false) assumptions that people make when building distributed systems, to their sorrow.

Today I want to talk about one of those fallacies:

There is one administrator.

I like to add the term competent in there as well.

A pretty significant amount of time in the development of RavenDB was dedicated to addressing that issue. For example, RavenDB has a lot of code and behavior around externalizing metrics. Both its own and the underlying system.

That is a duplication of effort, surely. Let’s consider the simplest stuff, such as CPU, memory and I/O resource utilization. RavenDB makes sure to track those values, plot them in the user interface and expose that to external monitoring systems.

All of those have better metrics sources. You can ask the OS directly about those details, and it will likely give you far better answers (with more details) than RavenDB can.

There have been numerous times where detailed monitoring from the systems that RavenDB runs on was the thing that allowed us to figure out what is going on. Having the underlying hardware tell us in detail about its status is wonderful. Plug that into a monitoring system so you can see trends and I’m overjoyed.

So why did we bother investing all this effort to add support for this to RavenDB? We would rather have the source data, not whatever we expose outside. RavenDB runs on a wide variety of hardware and software systems. By necessity, whatever we can provide is only a partial view.

The answer to that is that we cannot assume that the administrator has set up such monitoring. Nor can we assume that they are able to.

For example, the system may be running on a container in an environment where the people we talk to have no actual access to the host machine to pull production details.

Having a significant investment in self-contained set of diagnostics means that we aren’t limited to whatever the admin has set up (and has the permissions to view) but have a consistent experience digging into issues.

And since we have our own self contained diagnostics, we can push them out to create a debug package for offline analysis or even take active actions in response to the state of the system.

If we were relying on external monitoring, we would need to integrate that, each and every time. The amount of work (and quality of the result) in such an endeavor is huge.

We build RavenDB to last in production, and part of that is that it needs to be able to survive even outside of the hothouse environment.

time to read 2 min | 256 words

After achieving 1.25 million ops/sec, I decided to see what would happen if I would change the code to support pipelining. That ended up being quite involved, because I needed to both keep track of all the incoming work as well as send the work to multiple locations. The code itself is garbage, in my opinion. It is worth it only as far as it points me inthe right direction in terms of the overall architecture. You can read it below, but it is a bit complex. We read from the client as much as we are able, then we send it to each of the dedicated threads to run it.

In terms of performance, it is actually slower than the previous iteration (by about 20%!), but it serves a very important aspect, it makes it easy to tell where the costs are.

Take a look at the following profiler result:

image

You can see that we are spending a lot of time in I/O and in string processing. The GC time is also quite significant.

Conversely, when we actually process the commands from the clients, we are spending most of the time simply idling.

image

I want to tackle this in stages. The first part is to stop using strings all over the place. The next stage after that will likely be to change the I/O model.

For now, here is where we stand:


time to read 5 min | 974 words

My previous attempts to write a Redis clone were done in about as straightforward a way as possible. Open a socket to listen on, have a separate Task for each client that reads from the network, parse the command and execute it. There are some smarts around supporting pipelining, but that is pretty much it.

Let’s take a step back and build ourselves a Redis clone that matches the actual Redis architecture more closely. In order to do that, I’ll need to do everything in a single thread. That is… surprisingly hard to do in C#. There are no APIs for doing the kind of work that Redis is doing. To be rather more exact, there is the Socket.Select() method, but that requires building everything on top of that (meaning that we have to handle buffering, string handling, etc).

Given that this is a way station to the final proposed architecture, I decided to skip this entirely. Instead, I’m going to focus first on removing the major bottleneck in the system, the ConcurrentDictionary.

The profiler results show that the biggest cost we have here is the scalability of the concurrent dictionary. Even when we tried to shard it across 1024 locks, it still took almost 50% of our runtime. The question is, can we do better? One good option that we can try is to shard things directly. Instead of using a single concurrent dictionary, we will split it to separate dictionaries, each one of them would be accessed without concurrency.

The idea goes like this, we’ll have the usual read & write for the clients. But instead of processing the command inline, we’ll route it to a dedicated thread (with its own dictionary) to do the work. I set it so we’ll have 10 such threads (assuming they will reside on individual cores and that I’ll be able to process all I/O on the other 6 cores.

Here are the results after the change:

============================================================================================================================
Type         Ops/sec     Hits/sec   Misses/sec    Avg. Latency     p50 Latency     p99 Latency   p99.9 Latency       KB/sec
----------------------------------------------------------------------------------------------------------------------------
Sets       113703.56          ---          ---         3.06261         0.95900        25.59900        39.93500     33743.38
Gets      1137015.79     19211.78   1117804.01         3.06109         0.95900        25.59900        39.93500     49150.52
Waits           0.00          ---          ---             ---             ---             ---             ---          ---
Totals    1250719.35     19211.78   1117804.01         3.06122         0.95900        25.59900        39.93500     82893.90

Note that we are now at 1.25 million, almost 25% better than the previous run.

Here are some profiler results of running this code:

image

So in this case, we are spending a lot of time doing string processing of various kinds, waiting for GC (almost 30%). The costs for collections went down a lot (but we’ll see that it shifted somewhat).

There are some other things that pop to mind, take a look here:

image

That is a surprising cost for a “simple” property lookup. The substrings calls are also expensive, over 6% of the overall runtime.

When looking at other parts of the system, we have:

image

This is really interesting, because we spend a lot of time just waiting for items in the queue. We could probably do more things in there rather than just wait.

I also tried various other concurrency values. With a single ExecWorker running, we have 404,187 ops/sec and with two of them we are at 715,157 ops/sec. When running with four threads dedicated to processing the requests, we are at 1,060,622.24 ops/sec.

So it is obvious that we need to rethink this approach for concurrency. We aren’t able to properly scale to bigger values.

Note that this approach also does not take advantage of pipelining. We process each command separately from all else. My next move is to add support for pipelining with this approach and measure that impact.

On the one hand, we are still at around the million mark, but given that I spent very little time (and not a lot of complexity) getting an extra 250,000 ops/second from that level of change is encouraging. The profiler is also telling us that there are more things that we can do, but I want to focus on fixing the approach we take first.

Here is the current state of the code, so you can compare it to the original one.

time to read 5 min | 920 words

In the previous post, I wrote a small Redis clone using the most naïve manner. It was able to hit nearly 1M queries per second on our test instance (c6g.4xlarge, using 16 cores and 64 GB of memory). Before we get any deeper into optimization, it is worth understanding where the time is actually being spent. I run the server under a profiler, to see the various costs.

I like using dotTrace as a profiler, while using the Tracing mode, since that gives me execution time as well as the number of calls. Often enough I can reason a lot about the system performance just from those details.

Take a look at the following stats, this is the breakdown of costs in the actual processing of the connection:

image

And here it is when we break it up by

image

You can see that the cost of FlushAsync() dominates. I’m going to form a hypothesis here. When we call FlushAsync() on the StreamWriter, we’ll also flush to the underlying stream. Looking deeper into the call stack that looks like we’ll need a separate packet per command at the TCP level.

What will happen if we’ll change the StreamWriter’s AutoFlush to true, which will cause it to write immediately to the underlying stream, but won’t call the flush on the TCP stream. That will allow the TCP stream to buffer writes more efficiently.

The code change involved is removing the FlushAsync() calls and initializing the StreamWiter like so:

Let’s run the benchmark again, which will give us (on my development machine):

  • 138,979.57 QPS – using AutoFlush = true
  • 139,653.98 QPS – using FlushAsync

Either option is a wash, basically. But here is why:

image

Basically, AutoFlush set to true will flush not just the current stream, but also the underlying stream, putting us in the same position.

The problem is that we need to flush, otherwise we may buffer results in memory that won’t be sent to the client. Redis benchmarks rely heavily on pipelining (sending multiple commands at once), but it is entirely possible that you’ll get a bunch of commands, write them (to the buffer) and then not send anything to the client since the output buffer isn’t full. We can optimize this quite easily, using the following change:

What I’m doing here is writing to the StreamWriter directly, and I’ll only flush the buffer if there is no more input waiting. That should reduce the number of packets we send significantly, and it does. Running the benchmark again gives us:

  • 229,783.30 QPS – using delayed flushing

That is almost twice as fast, which is impressive, for such a small change. The idea is that we are able to buffer our writes far more, but not delay them too much. If we write enough to the StreamWriter buffer, it will flush itself automatically, and we’ll only actually flush the StreamWriter manually when we have nothing further to read, which we do in parallel with the reading itself.

Here is the new cost structure:

image

And the actual methods called:

image

If we’ll compare this to the first profiling results, we can find some really interesting numbers. Before, we have called FlushAsync per command (see the ExecuteCommand & FlushAsync), now we call this a lot less often).

You can see that most of the time is now in the “business logic” for this system, and from the subsystems breakdown, a lot of the cost is now in the collections.

The GC costs here also went down significantly (~5%). I’m fairly certain that this is because we flush to the TCP stream, but I didn’t check too much.

Note that string processing and GC take a lot of time, but the Collections / ExecuteCommand is taking the vast majority of the costs.

If we look into that, we’ll see:

image

And that is… interesting.

Mostly because the major costs are in TryAddInternal. We know that there is high contention in this scenario, but 92% of the time spent in the method directly? What is it doing? Looking at the code, it becomes obvious:

image

The ConcurrentDictionary is sharding the calls between the locks. And the number of locks is defined by the number of the cores we have by default. The more concurrency we have, the more we can benefit from increasing the amount. I tried setting this to 1024 and running it under the profiler, and this gave me a few percentage points improvements, but not much more. Valuable, but not at the level we are playing with.

Even so, we managed to get some interesting details from this exploration. We know that we’ll have to deal with the dictionary implementation, since it takes roughly 50% of our time. I also want to pay some attention to these numbers:

image

Right now, we need to figure out how to make it faster in terms of collections, but we also have to consider overall GC costs as well as the string processing details. More on that in the next post.

time to read 5 min | 849 words

I run into this project, which aims to be a Redis clone with better performance and ease of use. I found it interesting because one of the main selling points there was that it is able to run in a multi threaded mode (instead of Redis’ single thread per process model). They use memtier_benchmark (part of Redis) to test their performance. I got curious about how much performance I could get out of the system if I built my own Redis clone in C#.

The first version I built was done pretty naively. The idea is to write it in a high level manner, and see where that puts us. To make things interesting, here are the test scenarios:

  • The memtier_benchmark is going to run on c6g.2xlarge instance, using 8 cores and 32 GB of memory.
  • The tested instance is going to run on c6g.4xlarge, using 16 cores and 64 GB of memory.

Both of those instances are running on the same availability zone.

The command I’m going to run is:

memtier_benchmark –s $SERVER_IP -t 8 -c 16 --test-time=30 --distinct-client-seed -d 256 --pipeline=30

What this says is that we’ll use 8 threads (number of cores on the client instance) with 32 connections per thread, we’ll use 20% writes & 80% reads with data size that is 256 bytes in size. In total, we’ll have 256 clients and out tests are going to continuously push more data into the system.

The server is being run using:

dotnet run –c Release

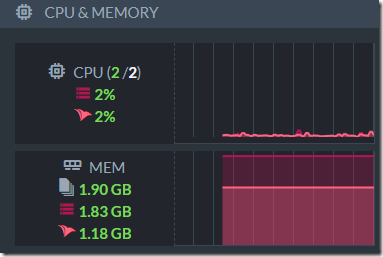
Here is an example of the server while under this test:

image

I chose 30 seconds for the test duration to balance doing enough work to feel what is going on (multiple GC cycles, etc) while keeping the test duration short enough that I won’t get bored.

Here are the naïve version results:

============================================================================================================================
Type         Ops/sec     Hits/sec   Misses/sec    Avg. Latency     p50 Latency     p99 Latency   p99.9 Latency       KB/sec
----------------------------------------------------------------------------------------------------------------------------
Sets        86300.19          ---          ---         8.14044         0.92700        99.83900       196.60700     25610.97
Gets       862870.15     36255.57    826614.58         8.10119         0.91900        99.32700       196.60700     42782.42
Waits           0.00          ---          ---             ---             ---             ---             ---          ---
Totals     949170.34     36255.57    826614.58         8.10476         0.91900        99.32700       196.60700     68393.39

So the naïve version, using C#, doing almost nothing, is almost touching the 1 million queries / sec. The latency, on the other hand, isn’t that good. With the p99 at almost 100ms.

Now that I got your attention with the numbers and pretty graphs, let me show you the actual code that I'm running. This is a “Redis Clone” in under 100 lines of code.

Just a few notes on the implementation. I’m not actually doing much. Most of the code is there to parse the Redis protocol. And the code is full of allocations. Each command parsing is done using multiple string splits and concats. Replies to the client require even more concats. The “store” for the system is actually just a simple ConcurrentDictionary, without anything to avoid contention or high costs.

The manner in which we handle I/O is pretty horrible, and… I think you get where I’m going here, right? My goal is to see how I can use this (pretty simple) example to get more performance without having to deal with a lot of extra fluff.

Given my initial attempt is already at nearly 1M QPS, that is a pretty good start, even if I say so myself.

The next step that I want to take it to handle the allocations that are going on here. We can probably do better here, and I aim to try. But I’ll do that in the next post.

FUTURE POSTS

  1. Partial writes, IO_Uring and safety - about one day from now
  2. Configuration values & Escape hatches - 5 days from now
  3. What happens when a sparse file allocation fails? - 7 days from now
  4. NTFS has an emergency stash of disk space - 9 days from now
  5. Challenge: Giving file system developer ulcer - 12 days from now

And 4 more posts are pending...

There are posts all the way to Feb 17, 2025

RECENT SERIES

  1. Challenge (77):
    20 Jan 2025 - What does this code do?
  2. Answer (13):
    22 Jan 2025 - What does this code do?
  3. Production post-mortem (2):
    17 Jan 2025 - Inspecting ourselves to death
  4. Performance discovery (2):
    10 Jan 2025 - IOPS vs. IOPS
View all series

Syndication

Main feed Feed Stats
Comments feed   Comments Feed Stats
}