Oren Eini

CEO of RavenDB

a NoSQL Open Source Document Database

Get in touch with me:

oren@ravendb.net +972 52-548-6969

Posts: 7,546
|
Comments: 51,161
Privacy Policy · Terms
filter by tags archive
time to read 4 min | 683 words

Reading code is a Skill (with a capital letter, yes) that is really important for developers. You cannot be a good developer without it.

Today I want to talk about one aspect of this. The ability to go into an unfamiliar codebase and extract one piece of information out. The idea is that we don’t need to understand the entire system, grok the architecture, etc. I want to understand one thing about it and get away as soon as I can.

For example, you know that project Xyz is doing some operation, and you want to figure out how this is done. So you need to look at the code and figure that out, then you can go your merry way.

Today, I’m interested in understanding how the LMDB project writes data to the disk on Windows. This is because LMDB is based around a memory-mapped model, and Windows doesn’t keep the data between file I/O and mmap I/O coherent.

LMDB is an embedded database engine (similar to Voron, and in fact, Voron is based on some ideas from LMDB) written in C. If you are interested in it, I wrote 11 posts going through every line of code in the project.

So I’m familiar with the project, but the last time I read the code was over a decade ago. From what I recall, the code is dense. There are about 11.5K lines of code in a single file, implementing the entire thing.

I’m using the code from here.

The first thing to do is find the relevant section in the code. I started by searching for the WriteFile() function, the Win32 API to write. The first occurrence of a call to this method is in the mdb_page_flush function.

I look at this code, and… there isn’t really anything there. It is fairly obvious and straightforward code (to be clear, that is a compliment). I was expecting to see a trick there. I couldn’t find it.

That meant either the code had a gaping hole and potential data corruption (highly unlikely) or I was missing something. That led me to a long trip of trying to distinguish between documented guarantees and actual behavior.

The documentation for MapViewOfFile is pretty clear:

A mapped view of a file is not guaranteed to be coherent with a file that is being accessed by the ReadFile or WriteFile function.

I have my own run-ins with this behavior, which was super confusing. This means that I had experimental evidence to say that this is broken. But it didn’t make sense, there was no code in LMDB to handle it, and this is pretty easy to trigger.

It turns out that while the documentation is pretty broad about not guaranteeing the behavior, the actual issue only occurs if you are working with remote files or using unbuffered I/O.

If you are working with local files and buffered I/O (which is 99.99% of the cases), then you can rely on this behavior. I found some vaguereferences to this, but that wasn’t enough. There is this post that is really interesting, though.

I pinged Howard Chu, the author of LMDB, for clarification, and he was quick enough to assure me that yes, my understanding was (now) correct. On Windows, you can mix memory map operations with file I/O and get the right results.

The documentation appears to be a holdover from Windows 9x, with the NT line always being able to ensure coherency for local files. This is a guess about the history of documentation, to be honest. Not something that I can verify.

I had the wrong information in my head for over a decade. I did not expect this result when I started this post, I was sure I would be discussing navigating complex codebases. I’m going to stand in the corner and feel upset about this for a while now.

time to read 4 min | 672 words

A not insignificant part of my job is to go over code. Today I want to discuss how we approach code reviews at RavenDB, not from a process perspective but from an operational one. I have been a developer for nearly 25 years now, and I’ve come to realize that when I’m doing a code review I’m actually looking at the code from three separate perspectives.

The first, and most obvious one, is when I’m actually looking for problems in the code - ensuring that I can understand what is going on, confirming the flow makes sense, etc. This involves looking at the code as it is right now.

I’m going to be showing snippets of code reviews here. You are not actually expected to follow the code, only the concepts that we talk about here.

Here is a classic code review comment:

There is some duplicated code that we need to manage. Another comment that I liked is this one, pointing out a potential optimization in the code:

If we define the code using the static keyword, we’ll avoid delegate allocation and save some memory, yay!

It gets more interesting when the code is correct and proper, but may do something weird in some cases, such as in this one:

I really love it when I run into those because they allow me to actually explore the problem thoroughly. Here is an even better example, this isn’t about a problem in the code, but a discussion on its impact.

RavenDB has been around for over 15 years, and being able to go back and look at those conversations in a decade or so is invaluable to understanding what is going on. It also ensures that we can share current knowledge a lot more easily.

Speaking of long running-projects, take a look at the following comment:

Here we need to provide some context to explain. The _caseInsensitive variable here is a concurrent dictionary, and the change is a pretty simple optimization to avoid the annoying KeyValuePair overload. Except… this code is there intentionally, we use it to ensure that the removal operation will only succeed if both the key and the value match. There was an old bug that happened when we removed blindly and the end result was that an updated value was removed.

In this case, we look at the code change from a historical perspective and realize that a modification would reintroduce old (bad) behavior. We added a comment to explain that in detail in the code (and there already was a test to catch it if this happens again).

By far, the most important and critical part of doing code reviews, in my opinion, is not focusing on what is or what was, but on what will be. In other words, when I’m looking at a piece of code, I’m considering not only what it is doing right now, but also what we’ll be doing with it in the future.

Here is a simple example of what I mean, showing a change to a perfectly fine piece of code:

The problem is that the if statement will call InitializeCmd(), but we previously called it using a different condition. We are essentially testing for the same thing using two different methods, and while currently we end up with the same situation, in the future we need to be aware that this may change.

I believe one of the major shifts in my thinking about code reviews came about because I mostly work on RavenDB, and we have kept the project running over a long period of time. Focusing on making sure that we have a sustainable and maintainable code base over the long haul is important. Especially because you need to experience those benefits over time to really appreciate looking at codebase changes from a historical perspective.

time to read 4 min | 636 words

A customer was experiencing large memory spikes in some cases, and we were looking into the allocation patterns of some of the queries that were involved. One of the things that popped up was a query that allocated just under 30GB of managed memory during its processing.

Let me repeat that, because it bears repeating. That query allocated 30(!) GB(!) during its execution. Now, that doesn’t mean that it was consuming 30 GB, it was just the allocations involved. Most of that memory was immediately discarded during the operation. But 30 GB of garbage to cleanup puts a lot of pressure on the system. We took a closer look at the offensive query. It looked something like this:

from index “Notifications/RoutingAndPriority”
where startsWith(Route, $routeKeyPrefix)
order by
Priority desc

That does not seem like a query that should be all that expensive. But details matter, so we dove into this. For this particular query, the routes are hierarchical structures that are unique for each message. Something like:

  • notifications/traffic/new-york-city/67a81019-941b-4d04-a0db-0559ed45343c
  • notifications/emergency/las-vegas/0a8e18fb-563b-4b6a-8e93-e10e08239656

And the queries that were generated were using the city & topic to filter the information that they were interested in.

The customer in question had a lot of notifications going on at all times. And each one of their Routes was unique. Internally, RavenDB uses Lucene (currently Smile ) to handle searches, and Lucene is using an inverse index to execute queries.

The usual way to think about is like this:

image

We have a list of terms (Brown, Green & Purple) and each of them has a list of the matching documents that contain the particular term.

The process of issuing a prefix query then is easy, scan all entries that match the prefix and return their results. This is indeed what Lucene is doing. However… while it is doing that, it will do something like this:

Pay close attention to what is actually happening here. There are two enumerators that we work with. One for the terms for the field and one for the documents for a specific term.

All of this is perfectly reasonable, but there is an issue. What happens when you have a lot of unique values? Well, then Lucene will have a lot of iterations of the loop. In this case, each term has just a single match, and Lucene is pretty good at optimizing search by specific term.

The actual problem is that Lucene allocates a string instance for each term. If we have 30 million notifications for New York’s traffic, that means that we’ll allocate 30 million strings during the processing of the query. We aren’t retaining these strings, mind. They’ll be cleaned up by the GC quickly enough, but that is an additional cost that we don’t actually want.

Luckily, in this case, there is a much simple solution. Given that the pattern of the route is known, we can skip the unique portion of the route. That means that in our index, we’ll do something similar to:

Route = doc.Route.Substring(0, doc.Route.LastIndexOf('/') + 1)

Once that is done, the number of unique matches there would be negligible. There would be no more allocations galore to observe and overall system performance is much improved.

We looked into whether there is something that we can do with Lucene to avoid this allocations issue, but it is endemic to the way the API works. The longer term plan is to fix that completely, of course. We are making great strides there already Smile.

In short, if you are doing startsWith() queries or similar, pay attention to the number of unique terms that you have to go through. A simple optimization on the index like the one above can bring quite a bit of dividends.

time to read 4 min | 705 words

I want to comment on the following tweet:

When I read it, I had an immediate and visceral reaction. Because this is one of those things that sound nice, but is actually a horrible dystopian trap. It confused two very important concepts and put them in the wrong order, resulting in utter chaos.

The two ideas are “writing tests” and “producing high quality code”. And they are usually expressed in something like this:

We write tests in order to product high quality code.

Proper tests ensure that you can make forward progress without having regressions. They are a tool you use to ensure a certain level of quality as you move forward. If you assume that the target is the tests and that you’ll have high quality code because of that, however, you end up in weird places. For example, take a look at the following set of stairs. They aren’t going anywhere, and aside from being decorative, serves no purpose.

image

When you start considering tests themselves to be the goal, instead of a means to achieve it, you end up with decorative tests. They add to your budget and make it harder to change things, but don’t benefit the project.

There are a lot of things that you are looking for in code review that shouldn’t be in the tests. For example, consider the error handling strategy for the code. We have an invariant that says that exceptions may no escape our code when running in a background thread. That is because this will kill the process. How would you express something like that in a test? Because you end up with an error raised from a write to a file that happens when the disk is full that kills the server.

Another example is a critical piece of code that needs to be safely handle out of memory exceptions. You can test for that, sure, but it is hard and expensive. It also tend to freeze your design and implementation, because you are now testing implementation concerns and that make it very hard to change your code.

Reviewing code for performance pitfalls is also another major consideration. How do you police allocations using a test? And do that without killing your productivity? For fun, the following code allocates:

Console.WriteLine(1_000_000);

There are ways to monitor and track these kind of things, for sure, but they are very badly suited for repeatable tests.

Then there are other things that you’ll cover in the review, more tangible items. For example, the quality of error messages you raise, or the logging output.

I’m not saying that you can’t write tests for those. I’m saying that you shouldn’t. That is something that you want to be able to change and modify quickly, because you may realize that you want to add more information in a certain scenario. Freezing the behavior using tests just means that you have more work to do when you need to make the changes. And reviewing just test code is an even bigger problem when you consider that you need to consider interactions between features and their impact on one another. Not in terms of correctness, you absolutely need to test that, but in terms of behavior.

The interleaving of internal tasks inside of RavenDB was careful designed to ensure that we’ll be biased in favor of user facing operations, starving background operations if needed. At the same time, it means that we need to ensure that we’ll give the background tasks time to run. I can’t really think about how you would write a test for something like that without basically setting in stone the manner in which we make that determination. That is something that I explicitly don’t want to do, it will make changing how and what we do harder. But that is something that I absolutely consider in code reviews.

time to read 4 min | 753 words

In my last post, I looked into the infrastructure of mimalloc, to be frank. A few details on how it is actually hooking the system allocator when used, mostly. I’m still using what is effectively a random scatter/gather approach to the codebase. Mostly because it is small. I’m trying to… grok it would be the best term, I guess. I’m going over the code because it also give me a good idea about practices in what seems to be a damn good C codebase.

I should mention that I drove right into the code, there is also the tech report, which I intend to read, but only after I got through enough of the code to get a good feeling for it.

I run into the code in the options.c file, for instance:

image

This is a really nice way to get configuration values from the user. What I find really interesting, to be frank, is not the actual options, which would be interesting later on, but the fact that this is such a nice way to represent things in a readable manner.

I’m doing similar things in C# (a much higher level language) to create readable options (typically using dictionary & dictionary initializer). I like how the code is able to express things so succinctly in a language with far fewer features.

However, the order of parameters is critical (is should match the mi_option_t enum values), and there is no way to express this in the code.

I also liked this code, which is part of reading configuration values from env variables:

image

I like that this is using strstr() in reverse in this manner. It is really elegant.

Going over the OS abstraction layer, on the other hand, show some granliness, take a look here:

image

I actually simplified the code abit, because it also had #if there for BSD, Linux, etc. I find it harder to follow this style, maybe adding indentation would help, but I have had to read this function multiple times, filtering for specific OSes to get it right.

I did find this tidbit, which is interesting:

image

This is attempting to do allocation with exclusive access. I wonder how this is actually used for. It looks like mimalloc is attempting to allocate in specific addresses, so that should be interesting.

Indeed, in _mi_os_reset() they will explicitly ask the OS to throw the memory away by calling MADV_FREE or MEM_RESET. I find this interesting, because this let the OS know that the memory can be thrown away, but the allocation still persists. I’m currently looking into some fragmentation issues in 32bits, which won’t be helped by this scenario. Then again, I don’t think that mimalloc is primarily intended for 32 bits systems (I can see code handling 32 bits, but I don’t think this is the primary use case or that 32 bits had a lot of attention).

The mi_os_alloc_aligned_ensured() method call is doing some interesting things. If I need a 16MB buffer, but aligned on 1MB boundary, I have no real way to ask this from the OS. So this is implemented directly by over-allocating. To be fair, I can’t think of a good reason why you’ll want to do something like that (you have no guarantees about what the actual physical memory layout would be after all, and that is the only scenario I can think this would be useful. Given that page aligned memory (which is what you get anyway from the OS) is usually sufficient, I wonder what is the use case for that here.

I get why mimalloc have to struggle with this, given that it is limited to just returning a pointer back (malloc interface), and doesn’t have a good way to tell that it played games with the alignment when you pass a value to free(). There seems to be a lot of code around here to deal with memory alignment requirements.  I think that I’ll need to go up the stack to figure out what kind of alignment requirements it has.

That is enough for now, I think. I’m going to get to the core of mimalloc in the next post.

time to read 6 min | 1078 words

Unusually for me, I had a bit of a pause in reviewing Sled. As a reminder, Sled is an embedded database engine written in Rust. I last stopped looking at the buffer management, but I still don’t really have a good grasp of what is going on.

The next file is the iterator. It looks like it translates between segments and messages in these segments. Here is the struct:

image

As you can see, the log iterator holds an iterator of segments, and iterating over it looks like it will go over all the messages in the segments in order. Yep, here is the actual work being done:

image

The next() method is fairly straightforward, I found. But I have to point out this:

image

First, the will need call is really interesting. Mostly because you have a pretty obvious way to do conditional compiling that doesn’t really sucks. #if is usually much more jarring in the code.

Second, I think that the style of putting really important functions inside an if result in a pretty dense code. Especially since the if is entered only on error. I would have preferred to have it as a stand alone variable, and then check if it failed.

What I don’t understand is the read_segment call. Inside that method, we have:

image

There are also similar calls on segment trailer. It looks like we have a single file for the data, but stuff that is too large is held externally, in the blob files.

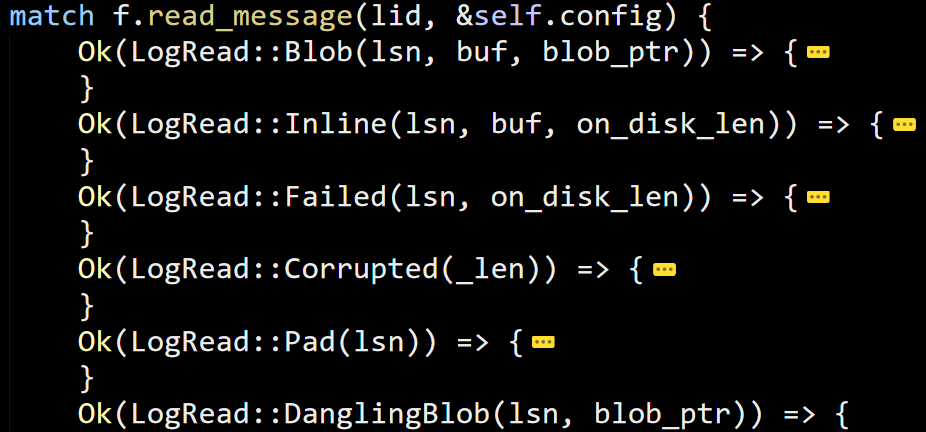
We then get to this guy, which I find really elegant way to handle all the different states.

image

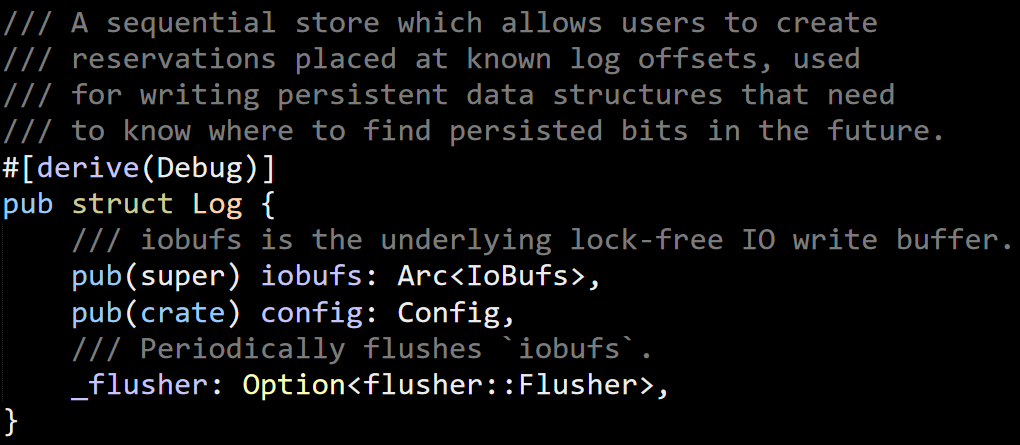
That is about it for interesting bits in the iterator, the next fun bit is the Log. I do have to admit that I don’t like the term log. It is too easy to get it confused with a debug log. In Voron, I used the term Journal or Write Ahead Journal (OH in the office: “did we waj it yet?”).

image

The fact that you need to figure out where to get the offset of the data you are about to write is really interesting. This is the method that does the bulk of the work:

image

Note that it just reserve and complete the operation. This also does not flush the data to disk. That is handled by the flusher or by explicit call. The reserve() method calls to reserve_internal() and there we find this gem:

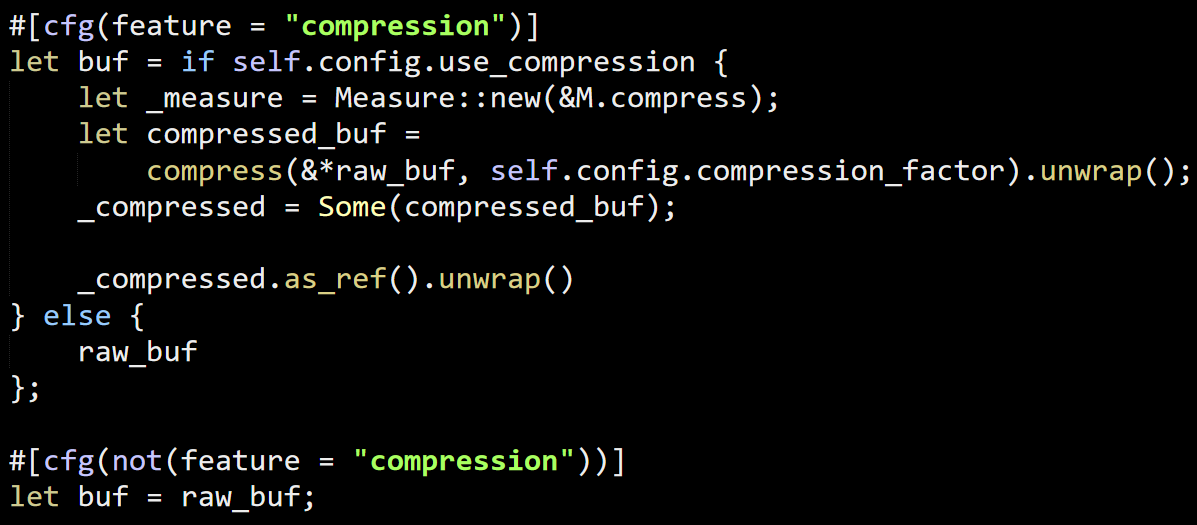
image

I know what it does (conditional compilation), but I find it really hard to follow. Especially because it looks like a mistake, with buf being defined twice. This is actually a case where an #if statement would be better, in my eyes.

Most of the code in there is to manage calls to the iobuf, which I already reviewed. So I’m going to skip ahead and look at something that is going to be more interesting, the page cache. Sled has an interesting behavior, in that it can shred a page into multiple location, requiring some logic to bring it all back together. That is going to be really interesting to look at, I hope.

The file stats with this:

image

And this… takes a while to unpack.  Remember that epoch is manual GC pattern for concurrent data structure without GC.

The cached_ptr value is a shared pointer to a Node (inside a lock free stack) that holds a CacheEntry with static lifetime and thread safe to a generic argument that must have static lifetime and be thread safe. And there is a unsigned long there as well.

No idea yet what is going on. But here is the first method on this struct:

image

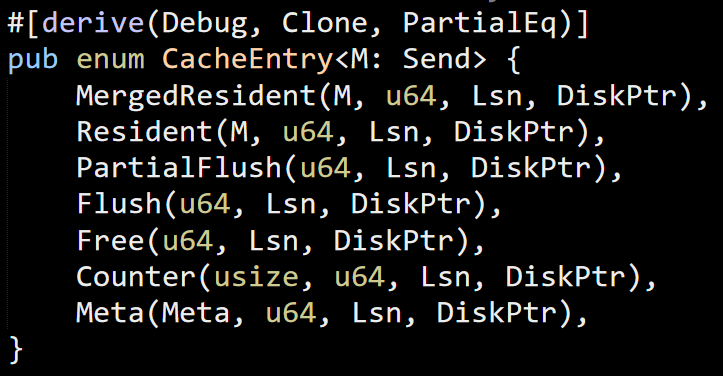
That is… a lot. The cache entry is a discriminated union with the following options:

image

There are some awesome documentation comments here, including full blown sample code that really help understand what is going on in the code.

There seems to be a few key methods that are involved here:

  • allocate(val) – create a new page and write an initial value, gets back a page id.
  • link(id, val) – make a write to a page id. Which simply write a value out.
  • get(id) – read all the values for a page id, and uses a materializer to merge them all to a single value.
  • replace(id, val) – set the page id to the new value, removing all the other values it had.

The idea here, as I gather. Is to allow sequential writes to the data, but allow fast reads, mostly by utilizing SSD’s random read feature.

I’m trying to follow the code, but it is a bit complicated. In particular, we have:

image

This try to allocate either a free page or allocate a new one. One of the things that really mess with me here is that the use of the term Page. I’m using to B+Tree, where a page is literally some section of memory. Here it refers to something more nebulous. Key point here, I don’t see where the size is specified. But given that you can link items to page, that sort of make sense. I just need to get used to Pages != storage.

The fact that all of this is generic also make it hard to follow what is actually going on.  I’m getting lost in here, so I think that I’ll stop for now.

time to read 4 min | 695 words

FASTER is an interesting project, with some unique approaches to solving their tasks that I haven’t encountered before. When I initially read the paper about a year or so ago, I was impressed with what they were doing, even I didn’t quite grasp exactly what was going on. After reading the code, this is now much clearer. I don’t remember where I read it, but I remember reading a Googler talking about the difference between Microsoft and Google with regards to publishing technical papers. Google would only publish something after it has been in production for a while (and probably ready to sunset Smile) while Microsoft would publish papers about software that hasn’t been deployed yet.

The reason I mention this is that FASTER isn’t suitable for production. Not by a long shot. I’m talking about issues such as swallowing errors, writing to the console as an error handling approach, calling sleep(), lack of logging / tracing / visibility into what is going on in the system. In short, FASTER looks like it was produced to support the paper. It is proof of concept / research code, not something that can take and use.

You can see it clearly in the way that the system is designed to be operated. You have dedicated threads that process requests as fast as they possibly can. However, there is no concept of working in any kind of operational environment, you can’t start using FASTER from an ASP.Net MVC app, for example. They models are just too different. I can think of a few ways to build a server using the FASTER model, but they are all pretty awkward and very specialized. This lead to the next issue with the project, it is highly specialized solution.

It isn’t meant for general consumption. In fact, as I can figure out, this is perfect if you have a relatively small working set that you do a lot of operations on. The examples I have seen given are related to tracking ads, which is a great example. If you want to store impressions on an ad, the active ads are going to pretty small, but you are going to have a lot of impressions on them. For other stuff, I don’t see a lot of usage scenarios.

FASTER is limited in the following ways:

  • Get / Set / Update only – no way to query
  • No support for atomic operations on more than a single key
  • Can support fixed length values only
  • Crash means data loss (of the most recent 14.4 GB, usually)
  • The API is awkward to use, and you need to write a bit of (non trivial) code for each key/val you want to store.
  • No support for compaction of data beyond dropping the oldest entries

Some of these issues can be mitigated. For example, compaction can be implemented, and you can force data to be written to disk faster if you want to, but those aren’t in the box and require careful handling.

Now that I have gone over the code, I’m not quite sure what was the point there, to be honest. In terms of performance, you can get about 25% of the achieved performance by just using ConcurrentDictionary in .NET, I’m pretty sure that you can do better by literally just using a concurrent hash map in C++. This isn’t something that you can use as a primary data store, after all, so I wonder why not just keep all the data in memory and be done with it.

I liked the mutable / read only portions of the log, that is certainly a really nice way to do it, and I’m sure that the epoch idea simplified things during the implementation with the ability to not worry about concurrent accesses. However, the code is complex and I’m pretty sure that it is not going to be fun to debug / work with in real world scenarios.

To sum it up, interesting codebase and approaches, but I would caution from using it for real. The perf numbers are to salivate over,  but the manner in which the benchmark was written means that it is not really applicable for any real world scenario.

time to read 5 min | 817 words

So far, I ignored anything in FASTER about how the data actually hits the disk. Based on my reading of the code and the paper, here is what I think that is going on. FASTER works in segments and in conjunction with its allocator. When you create a new instance, you have to define what would be the log size. From looking at the code, they seem to be favoring 16GB as the default size of the log. This is passed to PersistentMemoryMalloc, which uses pages of 32MB each to manage the memory. Out of these 16GB, 14.4GB are considered to be mutable and 1.6 GB is considered to be read only.

On startup, this class allocates two pages (64MB). Whenever FASTER needs more memory, such as to store a new record, it will eventually call to this method:

image

Again we have num_slots that actually means size in bytes, but I’ll leave my pet peeves aside.

You can see that this allocates from tail of the page use Reserve, which does an atomic operation. If we run out of space in the 32MB page, the caller need to call NewPage() to handle the new allocation. This plays together with the buffer management and the epoch. In particular, here is how a new page is allocated in the normal case. Assuming we just started and we consumed 64MB of memory, the new entry will allocate the 3rd page. This will also move the section of read only memory when there is a new page allocated and the number of active pages is beyond 14.4 GB.

image

What this means, in practice, is that FASTER typically has a 14.4GB range in which all operations are working on purely mutable memory. That means that two impressions on the same ad will end up being very close to simply Interlocked.Increment on the relevant value. This is the key for the performance that FASTER exhibits.

What happens once we start going beyond the 14.4 GB? FASTER will begin to move data to the read only section. In this case, it means that the any new modifications to the data will create a new copy of it in the mutable section.

At the same time, PageAlignedShiftReadOnlyAddress() will also starts an async process of writing these readonly pages to disk. Here is how it works:

image

If the read_only_address was updated, FASTER calls to BumpCurrentEpoch() and will execute OnPagesMarkedReadOnly() when the Epoch moves beyond this range (this works because then it is guaranteed that no one may mutate this memory).  That method looks like this:

image

The notion of read_only_address and safe_readonly_only_address is discussed in the paper quite nicely, by the way. AsyncFlushPages() writes the data to disk, as you would expect and updates various in memory structures.

Note that just having the data written to disk doesn’t remove the in memory copy. It is still available in memory until it is pushed back from the log by new data. Now that we understand how the data goes to the log and then to the disk, I want to figure out how the data is written in to the disk itself. Actual writes are handled here:

image

What you can see is that the destination offset is used to divide the data on disk to sections. Each section is 1GB in size. In other words, the way FASTER works is to write the data in 1 GB segments that are sequential over time.

This also plays into the expiration policy that FASTER employs. Because it uses a logs based system, it accumulate data over time and will need to handle that. The current way it deals with the problem is to just delete old files, this gets rid of the data in roughly time based order, which is suitable for the use case that the paper talks about. Another alternative is to read the old files, and move the still valid entries to the start. That doesn’t seem to be implemented and I think it will be pretty hard to do and likely consume a lot of resources.

I’ll probably have another summary post about FASTER, but that is pretty much it. I’ve ignored other parts (recovery, several state machines used to handle internal state, etc), but they aren’t important to grokking what it is actually doing. It is an interesting codebase, but it feels… incomplete. But I’ll reserve such thoughts to the summary post.

time to read 6 min | 1178 words

One of the things that FASTER claims is that it is suitable for larger than memory datasets with its hybrid log approach. I briefly went over that code during my review, but I want to dedicate this post to discussing how FASTER work with the disk.

FASTER is using async I/O on Linux & Windows to do its I/O, which present its own challenges, in particular, how do you handle an operation that is going to need to hit the disk ( to read old data). Another thing that I would like to discover is how does it save the data to disk. We’ll start from the reading data part.

Reading in FASTER looks like this:

image

You pass a context, a callback and serial number. I’m not sure what the serial is about, I think it is about checkpoints, but not sure. You’ll be called with the results once the operation executed.

Here is the core of the Read method:

image

FASTER first checks the in memory details, and if it isn’t there it is either not found or on disk. This is actually really interesting, because it implies that FASTER keep track of all of the data items purely in memory. Let’s go to InternalRead and figure out how that works. We already looked into most of that in the previous post FindEntry is called to find the entry by it’s hash. FASTER keep all the hashes in memory, even while it is writing entries to disk. This way, it can easily answer if an entry exists or not. Note that as I read things, if FASTER has more than a certain number of values, hash collision rate is going to reach high percentage, requiring often expensive I/O to figure out whatever the value exists.

If the value is in memory, your ReadContext.GetAtomic() method will be called. Here is one such implementation:

image

Where the value was defined as:

image

If the value has already been moved to the read only section, it will use the Get() method, instead, as an optimization. If the value is not on the mutable section or the read only section, it is on the disk, in which case we have this code:

image 

The go_async() method just records the status of the operation when we started the async process, it doesn’t actually invoke anything async. That is done in the caller code, Read().

image

This, in turn, gets us to this piece of code:

image

Note that the code is full of handling of the current phase of the thread. I’m ignoring all of these for now, they aren’t important.

The next thing to look at is the async I/O request, which gets us to:

image

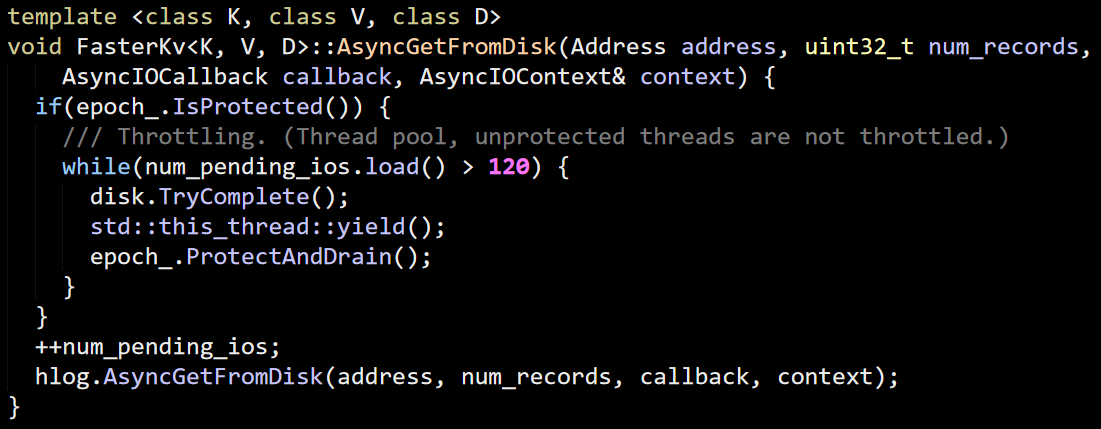
We first register the pending I/O, then actually starts to process the async call. Except that not really. AsyncGetFromDisk() isn’t actually doing I/O.  Instead, it seems to be focused on limiting the number of concurrent I/O operations that are going on.

In this case, if there are more than 120 pending I/Os, it will call io_getevents() in Linux and GetQueuedCompletionStatus() and try to process any completed I/O immediately.

image

ProtectAndDrain is more interesting. It asks the epoch to complete any pending operations. Such actions are the creation of a new segment file or the moving of a segment from memory to disk.

I find it interesting that FASTER chose to stall the thread until all pending I/Os are completed. Given their model, it would make more sense to push such operation into the thread ops and resume process other requests. I guess that they expect this to be either a rare case or using this for throttling overall system load. You might also have noticed the num_records arguments, this is used in the hlog method:

image

That was confusing, I expected this to be the number of records (as in, how many records are read from disk) but this is the number of bytes to read.

The C++ memory model make async code a bit complex. In particular, if you’ll look at the first code snippet in this post, you’ll see that we pass a stack allocated struct to the Read() method. Because this method can complete in an async manner, what FASTER will do is to perform a deep copy of the data. Combine that with lambda’s capturing state, and I’m pretty sure that this code will cause a very subtle memory corruption in rare cases.

image

What I think will happen is that we capture by ref the stack variable and in 99% of the cases, we’ll run this in sync mode, meaning that there will be no issues. Only if the value needs to be read from disk will you get an issue. Because that function will already return but you still have the callback (and the captured reference now pointing to something completely different) still active. I think that a C++ developer would recognize this, and the fact that C++ require you to be explicit about your captures make this a lot easier to deal with.

It is important to note that there is no good way to actually handle the async nature of certain operations here. Any code that actually handle the operation need to go in the callback.

Another aspect to remember is that just reading from the disk doesn’t mean that you got the right value. You might have gotten a hash collision:

image

In other words, if you have a way to generate hash collisions, as soon as the value hits the disk, you are going to be facing with making N disk I/O requests to find if you have the value or not.  Denial of service attacks against hash tables are well known and represent a significant risk of to services.

Next on my list if seeing how FASTER is actually writing the data to disk, but that will be in a separate post.

time to read 6 min | 1086 words

Continuing my stroll through the FASTER codebase, I want to try to get to the core stuff, not just the periphery. This is a bit hard, because there is a lot of code here and it seems to be hard to find where the real action is happening. I decided to find how FASTER is handling Get and Put operations.   There is something called InternalHashTable inside FasterKv, which seems promising,  so I’m going to follow up on that. Interestingly enough, it shows up as:

image

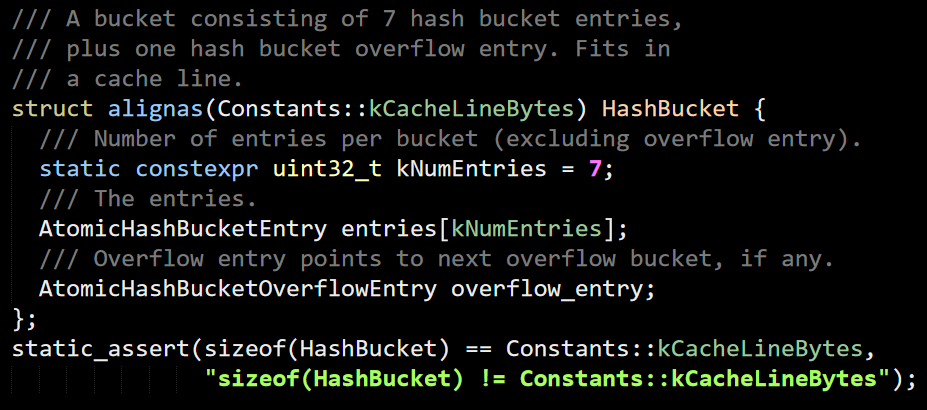
So there are some funky stuff here to consider too, but we’ll deal with that later, for now, I want to understand what it is doing with the InternalHashTable. Inside that class, there is the notion of bukcets:

image

And a bucket is:

image

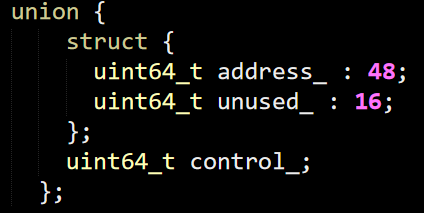
This starts to get interesting for me, so let’s dig deeper into HashBucketEntry, where they use the same union trick I talked about in my previous posts, this allow to easily define an atomic version of it with very little effort.

image

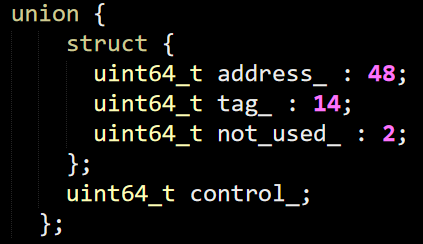
There is also the overflow entry definition, which looks like this:

image

I got to say, I’m really liking this approach for handling data packing as well as multi threading concerns. It also plays very well with the actual cache line architecture of modern CPUs.

There is also the KeyHash struct, whose heart is this:

image

So far, this lines us very neatly to how the FASTER paper talks about things. Given a KeyHash, here is how you get it’s bucket:

image

This simply index into the buckets_ array by taking the (size_ –1) bits from the hash itself. That tells me that the FASTER structure is very sensitive to the choice of hash function that will be used. This SO answer has some amazing detail on analysis of the output of hash functions with different outputs, which can give you some idea about why this matters so much. This post is an in depth discussion of this, as well of why the choice of hash function matters. This is enough for me to stop everything and try to find what kind of hash function is actually being used here.

The user get to define their own hash function, and if they do so badly (for example, use the identity function since they have an 8 bytes value and they need an 8 bytes hash) that is going to be fun. The function that they seem to be using in their examples is this one:

image

A bit of searching on the interweb didn’t narrow it down to something specific, it may be something that they wrote specifically for that. Given that the paper doesn’t mention this, it doesn’t seem to be something special.

Given that 40343 is a prime, it seems like a pretty common pattern of multiple by a prime with each 16 bits portion of the key. The idea is that the multiplication by prime will spread the bits around. No idea how high the quality of this hash function is, since actual analysis would take at least a few hours. At least at a glance,  it doesn’t seem to be awful, but I do wonder whatever something like FNV-1. In fact, this is very similar, but with different prime and offset and with addition instead of XOR.

The actual InternalHashTable class doesn’t actually do something, there are a few functions around checkpointing and recovery, but they aren’t very interesting at this point. I’m going back to actually working with the has table and looked at how reads work. They end up in the InternalRead method which does the majority of the work inside the FindEntry function. The first thing that happens there is:

image

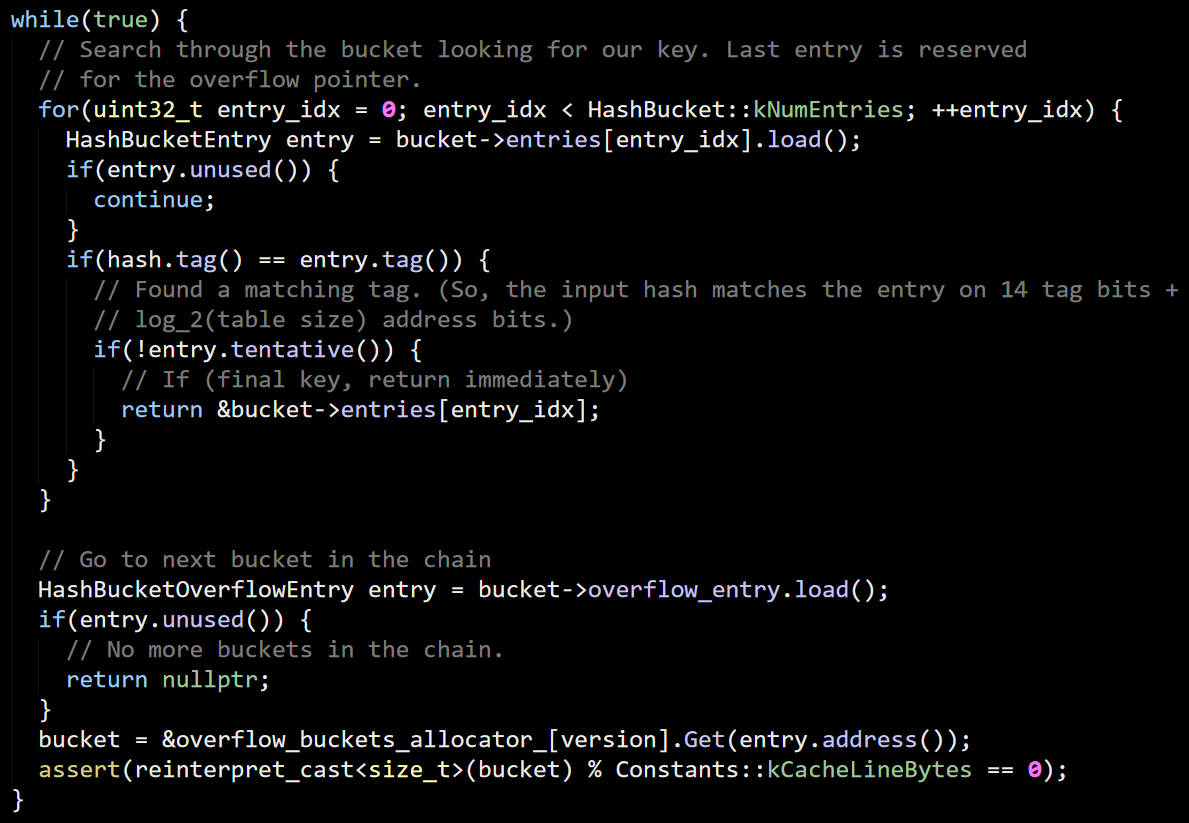
The first line is there to handle growing the hash table on the fly and will be ignored for now. As you can see, this basically just gives me the relevant bucket. Here is the next stage, once we have a bucket, we need to find the relevant entry that matches what we are looking for. Here is the code:

image

You can see that there are a bunch of stuff going on here. First, we run over the known entries in the bucket, trying to find an entry with the same tag. You can see the tentative usage, which is used to sync up between concurrent readers and writers. There may be more items in the bucket than we have space for, so there is also the concept of overflow. This is basically a linked list of 7 items at a time and likely to be pretty fast (frequently already in the higher tiers of the cache for commonly accessed data).
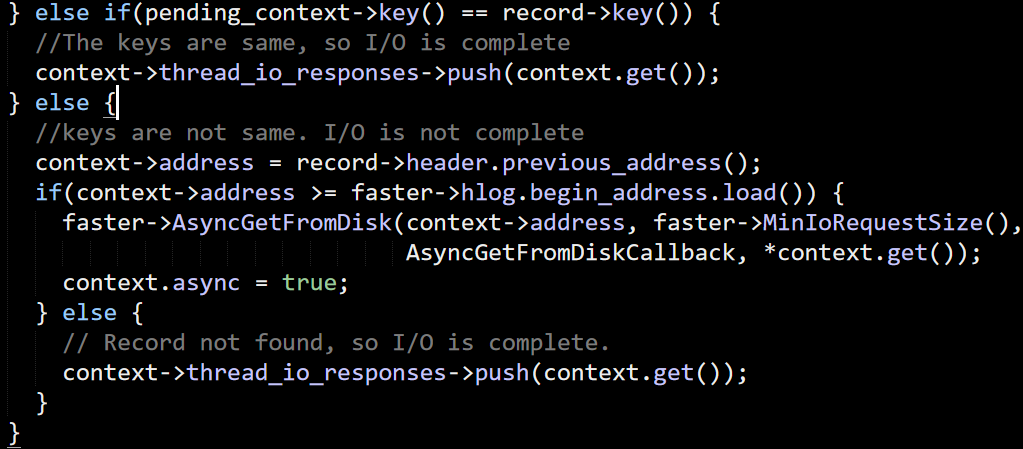
Now that we have the entry, let’s see what is done with it. I’m currently reading through the InternalRead code. Just finding the matching hash doesn’t really help us, we may have hash collisions, this is handled here:

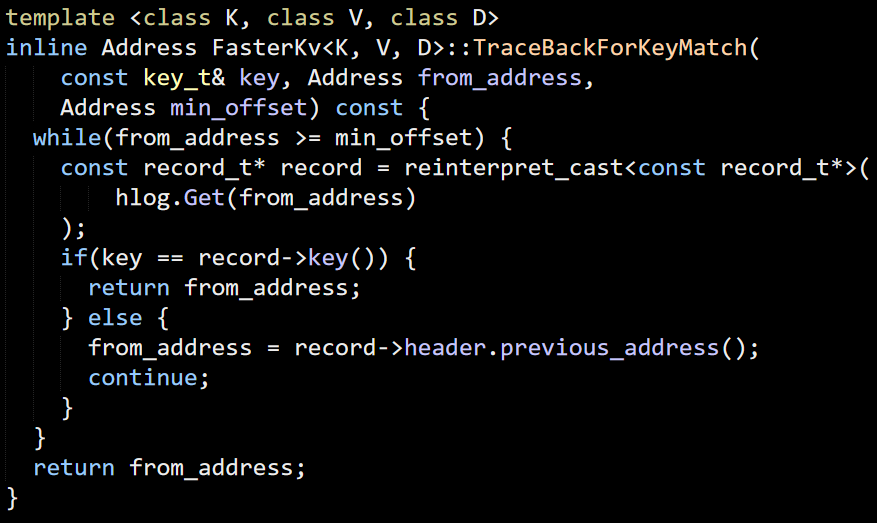
image

This is the first time that we actually run into the hybrid log (hlog here). But the basic idea is pretty obvious. Either the key match, or we have a pointer to the previous entry. I’m not seeing any handling of complete mismatch, though. I’m pretty sure that this is a bug (the behavior is different in the C# version).

This is enough for now, from here the InternalRead code is starting to do things with the hlog, state machine, etc. I’m going to handle that in a separate post.

FUTURE POSTS

  1. Partial writes, IO_Uring and safety - about one day from now
  2. Configuration values & Escape hatches - 5 days from now
  3. What happens when a sparse file allocation fails? - 7 days from now
  4. NTFS has an emergency stash of disk space - 9 days from now
  5. Challenge: Giving file system developer ulcer - 12 days from now

And 4 more posts are pending...

There are posts all the way to Feb 17, 2025

RECENT SERIES

  1. Challenge (77):
    20 Jan 2025 - What does this code do?
  2. Answer (13):
    22 Jan 2025 - What does this code do?
  3. Production post-mortem (2):
    17 Jan 2025 - Inspecting ourselves to death
  4. Performance discovery (2):
    10 Jan 2025 - IOPS vs. IOPS
View all series

Syndication

Main feed Feed Stats
Comments feed   Comments Feed Stats
}