Oren Eini

CEO of RavenDB

a NoSQL Open Source Document Database

Get in touch with me:

oren@ravendb.net +972 52-548-6969

Posts: 7,546
|
Comments: 51,161
Privacy Policy · Terms
filter by tags archive
time to read 2 min | 303 words

The coronavirus is a global epidemic and has had impact on the entire world. It has shaken the foundations of our society and has made things that would seem like bad science fiction a reality. The fact that most of the world is now under some form of quarantine is something that I would expect to see in a disaster movie, not in real life. And if we are in a disaster movie, I would like to jump over to the next scene please, and to formally submit a protest to the writers’ union.

Like everyone else, we have had to adjust to a very different mode of operations. Hibernating Rhinos is a distributed company, in the sense that we have teams working in different countries and continents. However, the majority of our people work in one of two offices (in Israel and in Poland). We have recently moved to a brand new office space which I’m incredibly proud of, which now sits empty. Given the needs of the current times, we have shifts to fully remote work across the board. Beyond the upheaval of normal life, we see that many customers and users are facing the same challenges as we do.

For that purpose, I have decided to offer all RavenDB customers two months of free support, to help navigate the challenges ahead. A lot of organizations are scrambling, because the usual workflow is interrupted and things aren’t as they used to. In these trying time, we want to make it as simple as possible for you to make use of RavenDB. 

This offer applies to support for RavenDB on your own machines as well as RavenDB Cloud.

With the hope that we would look back at this as we now look at Y2K, I would like to close by urging you to be safe.

time to read 4 min | 654 words

A user reported that a particular query returned the results in an unexpected order. The query in question looked something like the following:

image

Note that we first search by score(), and then by the amount of sales. The problem was that documents that should have had the same score were sorted in different locations.

Running the query, we would get:

image

But all the documents have the same data (so they should have the same score), and when sorting by descending sales, 2.4 million should be higher than 62 thousands. What is going on?

We looked at the score, here are the values for the part where we see the difference:

  • 1.702953815460205
  • 1.7029536962509155

Okay… that is interesting. You might notice that the query above has include explanations(), which will give you the details of why we have sorted the data as we did. The problem? Here is what we see:

image

I’m only showing a small piece, but the values are identical on both documents. We managed to reduce the issue to a smaller data set (few dozen documents, instead of tens of thousands), but the actual issue was a mystery.

We had to dig into Lucene to figure out how the score is computed. In the land of indirectness and virtual method calls, we ended up tracing the score computation for those two documents and figure out the following, here is how Lucene is computing the score:

image

They sum the various scoring to get the right value (highly simplified). But I checked, the data is the same for all of the documents. Why do we get different values? Let’s see things in more details, shall we?

image

Here is the deal, if we add all of those together in calculator, we’ll get: 1.702953756

This is close, but not quite what we get from the score. This is probably because calculator does arbitrary precision numbers, and we use floats. The problem is, all of the documents in the query has the exact same numbers, why do we get different values.

I then tried to figure out what was going on there. The way Lucene handle the values, each subsection of the scoring (part of the graph above) is computed on its own and them summed. Still doesn’t explain what is going on, then I realized that Lucene is using a heap of mutable values to store the scorers at it was scoring the values. So whenever we scored a document, we will mark the scorer as a match and then put it in the end of the heap. But the order of the items in the heap is not guaranteed.

Usually, this doesn’t matter, but please look at the above values and consider the following fact:

What do you think are the values of C and D in the code above?

  • c = 1.4082127
  • d = 1.4082128

Yes, the order of operations for addition matters a lot for floats. This is expected, because of the way floating points are represented in memory, but unexpected.

The fact that the order of operations on the Lucene scorer is not consistent means that you may get some very subtle bugs. In order to avoid reproducing this bug, you can do pretty much anything and it will go away. It requires very careful setup and is incredibly delicate. And yet it tripped me hard enough to make me lose most of a day trying to figure out exactly where we did wrong.

Really annoying.

time to read 2 min | 219 words

I announced the beta availability of RavenDB 5.0 last week, but I missed up on some of the details on how to enable that. In this post, I’ll give you detailed guide on how to setup RavenDB 5.0 for your use right now.

For the client libraries, you can use the MyGet link, at this time, you can run:

Install-Package RavenDB.Client -Version 5.0.0-nightly-20200321-0645 -Source https://www.myget.org/F/ravendb/api/v3/index.json

If you want to run RavenDB on your machine, you can download from the downloads page, click on the Nightly tab and select the 5.0 version:

image

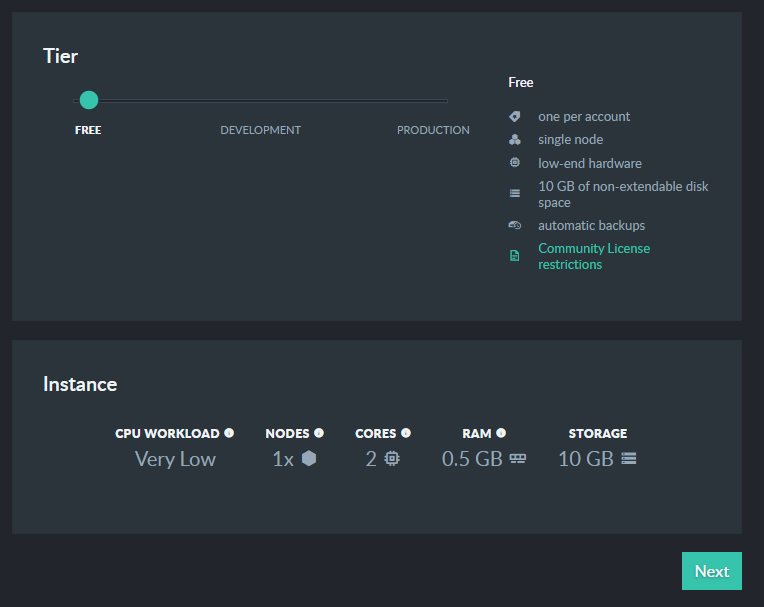
And on the cloud, you can register a (free) account and then, add a product:

image

Create a free instance:

image

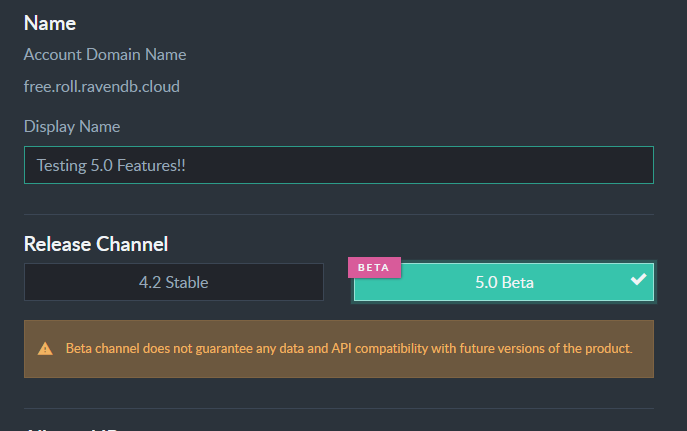
Select the 5.0 release channel:

image

And then create the RavenDB instance.

Wait a few minutes, and then you can connect to your RavenDB 5.0 instance and start working with the new features.

You can also run it with Docker using:

docker pull ravendb/ravendb-nightly:5.0-ubuntu-latest

time to read 2 min | 386 words

Every now and then I’ll run into a problem and say, “Oh, that would be a great thing to give in a job interview”. In addition to the Corona issue, Israel has been faced with multiple cases of hung parliament. Therefor, I decided that the next candidate we’ll interview will have to solve that problem. If you are good enough to solve conflicts in politics, you can solve conflicts in a distributed system.

Here is the problem, given the following parliament’s makeup, find all the possible coalitions that has 61 or greater votes.

  • Likud – 36 seats
  • KahulLavan – 33 seats
  • JointList – 15 seats
  • Shas – 9 seats
  • YahadutHatura – 7 seats
  • IsraelBeitenu – 7 seats
  • AvodaGesherMeretz – 7 seats
  • Yemina – 6 seats

There is a total of 120 seats in the Israeli parliament and you need 61 seats to get a coalition. So far, so good, but now we come to the hard part, not all parties like each other. Here is the make up of the parties’ toleration to one another:

Likud KahulLavan JointList Shas YahadutHatora IsraelBeitenu AvodaGesherMeretz Yemina
Likud -0.5 -1.0 0.95 0.95 -0.2 -0.8 0.95
KahulLavan -0.9 -0.6 -0.5 -0.5 0.5 0.8 -0.2
JointList -0.9 -0.3 -0.6 -0.6 -1.0 -0.2 -1.0
Shas 0.96 -0.7 -0.6 0.9 -1.0 -0.7 0.8
YahadutHatora 0.97 -0.6 -0.6 0.92 -1.0 -0.6 0.7
IsraelBeitenu -0.4 -0.1 -1.0 -0.99 -0.99 -0.6 0.1
AvodaGesherMeretz -0.95 0.98 0.3 -0.89 -0.89 -0.01 -0.75
Yemina 0.999 -0.92 -1.0 0.86 0.85 -0.3 -0.4

As you can see, the parties are ranked based on how probable they are to seat with one another. Note that just this listing of probabilities is probably highly political and in the time since the last election (all of a week ago), the situation has likely changed.

All of that said, I don’t really think that it is fair of a job candidate to actually solve the issue at an interview. I’m pretty sure that would require dynamic programming and a lot of brute force (yes, this is a political joke), but the idea is to get a list of ranked coalition options.

If you want to try it, the initial parameters are here:

And hey, we won’t get a government out of this, but hopefully we’ll get a new employee Smile.

time to read 3 min | 523 words

A RavenDB user called us with a very strange issue. They are running on RavenDB 3.5 and have run out of disk space. That is expected, since they are storing a lot of data. Instead of simply increasing the disk size, they decided to take the time and simply increase the machine overall capacity. They moved from a 16 cores machine to a 48 cores machine with a much larger disk.

After the move, they found out something worrying. RavenDB now used a lot more CPU. If previous the average load was around 60% CPU utilization, now they were looking at 100% utilization on a much more powerful machine. That didn’t make sense to us, so we set out to figure out what was going on. A couple of mini dumps and we were able to figure out what was going on.

It got really strange because there was the following interesting observation:

  • Under minimal load / idle – no CPU at all
  • Under high load – CPU utilization in the 40%
  • Under medium load – CPU utilization at 100%

That was strange. When there isn’t enough load, we are at a 100%? What gives?

The culprit was simple: BlockingCollection.

“Huh”, I can hear you say. “How can that be?”

A BlockingCollection should not be the cause of high CPU, right? It is in the name, it is blocking. Here is what happened. That blocking collection is used to manage tasks, and by default we are spawning threads to handle that at twice the number of available cores. All of these threads are sitting in a loop, calling Take() on the blocking collection.

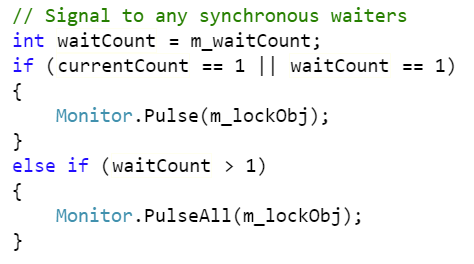
The blocking collection internally is implemented as using a SemaphoreSlim, which call Wait() and Release() on the values as needed. Here is the Release() method notifying waiters:

image

What you can see is that if we have more than a single waiter, we’ll update all of them. The system in question had 48 cores, so we had 96 threads waiting for work. When we add an item to the collection, all of them will wake and try to pull an item from the collection. Once of them will succeed, and then rest will not.

Here is the relevant code:

image

As you can imagine, that means that we have 96 threads waking up and spending a full cycle just spinning. That is the cause of our high CPU.

If we have a lot of work, then the threads are busy actually doing work, but if there is just enough work to wake the threads, but not enough to give them something to do, they’ll set forth to see how hot they can make the server room.

The fix was to reduce the number of threads waiting on this queue to a more reasonable number.

The actual problem was fixed in .NET Core, where the SemaphoreSlim will only wake as many threads as it has items to free, which will avoid the spin storm that this code generates.

time to read 3 min | 454 words

I can a lot about the performance of RavenDB, a you might have noticed from this blog. A few years ago we had a major architecture shift that increased our performance by a factor of ten, which was awesome. But with the meal, you get appetite, and we are always looking for better performance.

One of the things we did with RavenDB is build things so we’ll have the seams in place to change the internal behavior without users noticing how things are working behind the scenes. We have used this capability a bunch of time to improve the performance of RavenDB. This post if about one such scenario that we recently implemented and will go into RavenDB 5.0.

Consider the following query:

image

As you can see, we are doing a range based query on a date field. Now, the source collection in this case has just over 5.9 million entries and there are a lot of unique elements in the specified range. Let’s consider how RavenDB will handle this query in version 4.2:

  • First, find all the unique CreatedAt values between those ranges (there can be tens to hundreds of thousands).
  • Then, for each one of those unique values, find all the match documents (usually, only one).

This is expensive and the problem almost always shows up when doing date range queries over non trivial ranges because that combine the two elements of many unique terms and very few results per term.

The general recommendation was to avoid running the query above and instead use:

image

This allows RavenDB to use a different method for range query, based on numeric values, not distinct string values. The performance different is huge.

But the second query is ugly and far less readable. I don’t like such a solution, even if it can serve as a temporary workaround. Because of that, we implemented a better system in RavenDB 5.0. Behind the scenes, RavenDB now translate the first query into the second one. You don’t have to do anything to make it happen (when migrating from 4.2 instances, you’ll need to reset the index to get this behavior). You just use dates as you would normally expect them to be used and RavenDB will do the right thing and optimize it for you.

To give you a sense of the different in performance, the query above on a data set of 5.9 million records will have the following performance:

  • RavenDB 4.2 - 7,523 ms
  • RavenDB 5.0 –    134 ms

As you can imagine, I’m really happy about this kind of performance boost.

time to read 3 min | 517 words

We got a query perf issue from a user. Given a large set of documents, we run the following queries:

image

Query time: 1 – 2 ms

And:

image

Query time: 60 – 90 ms

Looking into the details, I run the following query:

image

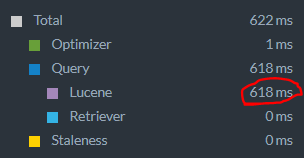
Which gives us the following details (I was running this particular result under a profiler, which is why we get this result):

image

That was strange, so I decided to look deeper and look into a profiler. I run five queries, and then look into where the costs are:

image

This is really strange. What is going on there?

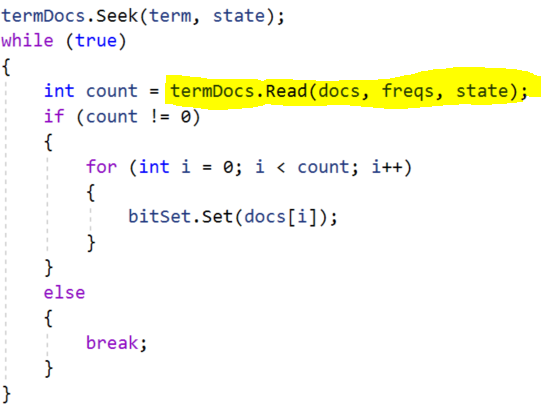
Looking into the reasons, it seems that the core of the issue is here:

image

What is going on here? The rough it is that we have: For each term inside the IN, find all documents and set the relevant bit in the bit set.

We have roughly 100,000 documents that match the query, so we have to do 100,000 index entry lookups. But how does this work when using an OR? It is much faster, but I really couldn’t see how that could be, to be frank.

Here is the profiler output of running the OR query, note that we call the same thing, SegmentTermDocs.Read as well here. In fact, the IN clause has been specifically optimized in order to make such things extremely efficient, what is going on here?

image

The key here is in the number of calls that we have. Note that in the OR case, we call it only 16 times? This is because of a very interesting dynamic very deep inside Lucene.

The query we have return no results. This is because there is no “customers/100” in the data set. That, in turn, means that the OR query that match between the two clauses need to do a lazy scan. There are no results, so the OR needs to only access evaluate very little of the potential space we have there. On the other hand, the way we implemented the IN clause, we select all the matches upfront, but then they are all filtered out by the query.

In other words, the OR query is lazy, and the IN is eager, which cause the difference. When we have data for the query, we see much closer behavior. The OR query is still about 20ms faster, but now that we understand what is going on, this is something that can be fixed.

time to read 1 min | 99 words

RavenDB 5.0 release train is gathering steam as we speak. The most recent change to talk about is the fact that you can now deploy RavenDB 5.0 beta in RavenDB Cloud:

image

This allows you to start experimenting with the newest features of RavenDB, including the time series capabilities.

Please take a look, the RavenDB 5.0 option is available at the free tier as well, so I would encourage you to give it a run.

As always, your feedback is desired and welcome.

time to read 1 min | 165 words

2020_03_18_BuildingAGrownUpDatabase_OrenEini_RavenDB_flyerDue to the Coronavirus issue that has been going around, my March 18 session has been moved to be online only.

You can register to the event here, we’ll also be sharing it live in the RavenDB facebook page.

As a reminder, the talk is: Building a Grown Up Database

A database is a complex, often fussy beast. For years, Oren Eini has made his living by fixing performance issues of various kinds. After seeing the same mistakes happen again and again, Oren decided to build his own database where these problems will never arise.
In this Webinar he will talk about the kind of features that make RavenDB a grown up database:
-- It doesn't need a full-time babysitter
-- Uses AI automatic indexing and self optimizing engines
-- Understands the operational environment and adjusts to it without the need for a human in the loop
-- High Availability
-- Secured development

FUTURE POSTS

  1. Partial writes, IO_Uring and safety - about one day from now
  2. Configuration values & Escape hatches - 5 days from now
  3. What happens when a sparse file allocation fails? - 7 days from now
  4. NTFS has an emergency stash of disk space - 9 days from now
  5. Challenge: Giving file system developer ulcer - 12 days from now

And 4 more posts are pending...

There are posts all the way to Feb 17, 2025

RECENT SERIES

  1. Challenge (77):
    20 Jan 2025 - What does this code do?
  2. Answer (13):
    22 Jan 2025 - What does this code do?
  3. Production post-mortem (2):
    17 Jan 2025 - Inspecting ourselves to death
  4. Performance discovery (2):
    10 Jan 2025 - IOPS vs. IOPS
View all series

Syndication

Main feed Feed Stats
Comments feed   Comments Feed Stats
}