Oren Eini

CEO of RavenDB

a NoSQL Open Source Document Database

Get in touch with me:

oren@ravendb.net +972 52-548-6969

Posts: 7,546
|
Comments: 51,161
Privacy Policy · Terms
filter by tags archive
time to read 5 min | 965 words

Recently JetBrains announce that dotTrace and dotMemory supports profiling applications on Linux. We have been testing these out for production usage, analyzing production scenarios and have been finding (and fixing) issues with about an order of magnitude less work and hassle. I have been a fan of JetBrains for over 15 years and they have been providing excellent software for a long time. So why this post (and no, this isn’t an ad and we are paying for a subscription to JetBrains for all our devs).

I’m super excited about being able to profile on Linux, because this is where most of our customers are now running. Before, we had to use arcane tooling and try to figure things out. With better tools, we are able to pinpoint issues almost immediately.

Here is the result of a single profiling session:

image

Here, we create a new List and then called ToArray() on it. All we had to do here was just create the array upfront, without going through resize and additional allocations.

image

Here we had to do a much move involved operation, remembering values across transactions to reduce load. Note how much time we saved!

And of course, just as important:

image

We tried to optimize an operation. It looks like it didn’t work out exactly as expected, so we need to take additional look at that.

These are about performance,  but even more important here is the ability to track memory and its sources. We were able to identify multiple places where we are using too much memory. In some cases, this is about configuration options. In one such case, limiting the amount of memory that we speculatively hold back resulted in a reduction of memory utilization over time from 3.5 GB to 800 MB. And these are much harder to figure out, because it is very hard to see the full picture.

Another factor that became obvious is that RavenDB’s current infrastructure was written in 2015 / 2016. The lowest pieces of the code were written on what was then called DNX. It was written to be high performance and stable. We didn’t have to touch it much ever since. Profiling memory utilization showed us that we hold a large number of values in the large object heap. This is because we need to have a byte[] that we can also send to native code, so we need to pin it. That was because we needed to call some methods, such as Stream.Read(byte[], int,int()  and then process it using raw pointers.

When the code was written, that was the only choice. Allocate it on the large object heap ( to reduce fragmentation) and run with it. Now, however, we have Memory<byte> and Span<byte>, which are much easier to work with for this scenario, so we can discard this specific feature and optimize our memory utilization further.

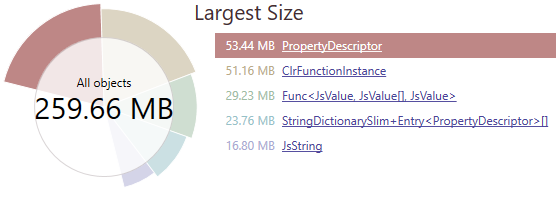
I don’t think we would have gotten to this without the profiler point a big red blinking arrow at the issue. And here is another good example, here is the memory state of RavenDB from dotTrace after running a benchmark consisting of a hundred thousands queries with javascript projections, this one:

image

And here is the state:

image

That is… interesting. Why do we have so many? The JavaScript engine is single threaded, but we have concurrent queries, so we use multiple such engines. We cache them, so we have:

image

And the mechanism there to clean them up will not be triggered normally. So we have this needlessly around. After fixing the cache eviction logic, we get:

image

Looking at the byte arrays here, we can track this down further, to see that the root cause is the pinning buffer I spoke about earlier. We’re handling that fix in a different branch, so this is pretty good sign that we are done with this kind of benchmark.

image

The down sides dotTrace and dotMemory, exist. On Linux, dotTrace only supports sampling, not tracing. That sounds like a minor issue, but it means that when I’m running the same benchmark, I’m missing something that I find critical. The number of times a method was run. If a method is taking 50% of the runtime, but it is invoked hundred millions times, I need a very different approach from something that happens three times. The lack on tracing option with number of times the methods were called is a real issue for my usual workflow.

For dotMemory, if you have a highly connected graph (for example, a doubly linked list) and a lot of objects, the amount of resources that it takes to analyze the process is huge. I deployed a cloud machine with 128 GB of RAM and 32 cores to try to analyze an 18 GB process dump. That wasn’t sufficient to give all the details, sadly. It was still able to provide me with enough so I could figure out what the issue was, though.

Another issue is that the visuals are amazing, but when I have a 120 millions links in a node, trying to represent that in the UI is a hopeless cause. I wish that there was a way to dump to text the same information that dotMemory provides. That would allow to analyze ridiculous amount of information in a structured manner.

time to read 2 min | 340 words

imageWhen building a system with API Keys, you need to consider a seemingly trivial design question. Consider the two class diagram options on the right. We have a user’s account and we need to allow access to a certain resource. We do that using an API Key. Fairly simple and standard, to be honest.

We have a deceptively simple choice. We can have a single API key per user or multiple keys. If we go with multiple keys, we have to manage a list of them (track their use separately from the account, etc). If we have a single key, we can just threat API Key as a synonym to the account. If you are using a relational database, it is also the different from having a simple column to having a separate table that you’ll need to join to.

A single API Key is simpler to the developer building the service. It is not an uncommon choice, and it is also quite wrong for you to go that way.

Consider the case of key rotation. That is something that is generally recommended to do on a regular basis. If you have a single API Key for an account, how are you going to make the switch? Updating the single field will cause all the requests that use it to fail. But there is going to be some delay between setting the API Key  and being able to update all the services that uses it.

A model that allow you to have multiple API Keys is much easier. Add the new API Key to the service, update your systems to reflect the new API key (which you can do at your leisure, without the rush to update failing systems) and then remove the old API Key.

There are other reasons why you would want multiple API Keys, but the operational flexibility of being able to rotate them without breaking with world is key.

time to read 2 min | 371 words

I posed a potential problem for a job interview. Given the following function, generate another key that has the same shard:

In other words, give “users/71” and a prefix of “orders/654”, generate a key that would be placed on the same shard as “users/71”. The answer in this case can be: “orders/654-vaueaa”.

In order to answer the question, we need to understand what is going on here. The function above is a fancy way to extract 16 bits of information from the key using a cryptographically hash function. MD5 is no longer considered secured, but given the fact that I’m needing just 16 bits, that is not an issue. The code above is slightly more complex than needed, I could simplify it to this and have the same effect (but not the same result, mind):

The need to generate a matching shard id is another way to say that we need a hash collision. Given that the key space is 2^16, and that we can assume that any mutation to the key will result effectively random changes to the result, we can simply generate different keys and try to see if they match. Here is a simple way to do so:

We are effectively throwing a dice and seeing if this match. So it is a probability game to wait until we have a collision. The actual implementation isn’t that important, what is interesting is to talk about the implications here:

  • Are there better ways to go about doing something like this? Not really, given that MD5 isn’t that broken.
  • How much time will it take to generate a shard id match? The answer, usually around 64K tries. But why is interesting. The birthday attack issues don’t play here, because we don’t need to match to multiple items, just one. So we role the dice and see if we match on the value.
  • Can we speed this up? Using a different hash function would probably help, yes.
  • What other ways do we have to handle this? Different shard id generation would allow much better alternative.

The last question is where we get into more interesting details about system design, ergonomics of the choices we make and get to see how the candidate actually thinks.

time to read 1 min | 118 words

Here is something that came up that I liked as task to handle in a job interview. We have the following function, generating a shard id from a document key:

There is a need to create a new document that must reside on the same shard as another document. The task is to write a function that would generate that id.

For example:

  • Key to match: users/71
  • Document id to modify: orders/654

The result can be: orders/654-22261 or orders/654-vaueaa

In other words, both orders/654-vaueaa and users/71 will have the same shard.

I like this because it is very easy to explain and has simple coding requirements. But it allows to go deep into several different fields of knowledge to understand the candidate’s solution.

time to read 12 min | 2272 words

Documents in RavenDB can be of arbitrary size. Technically, they are limited to 2 GB in size, but if you get anywhere near that, you have other issues. The worst case I have seen is a 700+ MB file, but RavenDB will issue warnings if you have documents that exceed the 5 MB range. This is mostly because the cost of sending those MB range documents back and forth. RavenDB itself is doing quite fine with those documents. However, most documents tend to be much smaller. The typical data size of documents is in the order of few to low dozens of KBs.

Since RavenDB 2.5, we had a document compression feature, which allowed you to trade CPU cycles for disk space. That was used quite successfully in a number of client projects. The way it worked was simple, all you need to do is to enable compression, and the documents would be compressed on the fly for you. That approached worked, and could see some interesting space savings, but it didn’t make the cut when we rebuilt RavenDB in 4.0.

Why is that?

There are a number of reasons for that. To start with, document compression in previous versions of RavenDB were applied on the individual document level. What this meant is that we would be able to compress away redundancies only inside a single document. There is still quite a lot that you can compress using this method, but it isn’t as efficient as compressing multiple documents all at once, in which case we can benefit from the cross document redundancies.

For example, the JSON data for all the documents that were created today have: “2020-04-13T”, when we compress many of them together, we can take advantage of this. When they are compressed independently, there is far fewer redundancies.

The other problem was that RavenDB 4.x was designed with performance in mind. Having to decompress the document data meant that we would have to do some additional processing on the documents as they came from disk. That was considered expensive and against our policy of zero copies. Given that the compression rate we saw wasn’t that attractive, we left that feature on the editing room floor.

What we did instead was address a far more common scenario for document compression, the compressing of values. In RavenDB, a large string value is going to be automatically (and transparently) compressed for you. But large, I’m talking larger than 127 characters.

In the last couple of years, we have run into numerous cases where people are storing stupendous amount of data inside of RavenDB. And we started to get complaints about two distinct (but related) issues:

  • RavenDB not having a schema meant that we repeat the JSON structure on each document.
  • They have very large number of documents that are very rarely touched (live archive) and were seeing storage issues at that scale.

When we set out to build document compression, we had a simple goal. We need to be efficient, there is some tradeoff of computation power to disk utilization, but it needs to be reasonable. We also need to be sure that our work pay off in terms of the space savings we got. That effectively ruled out the option of compressing documents independently. We needed a way to do that across documents.

I actually took a deep dive into compression almost 6 years ago and learned a lot about how compression algorithm work, what is possible and how it can be made to work with different scenarios. I’m not an expert, I want to emphasis that, and some of the things that are going on in the compression world are flat out opaque to me. But I learned enough to figure out how the parts come together.

Data compression is not something new. Other database offer value compression similar to RavenDB’s large string compression.This is usually done on a per value method. MySQL has support for compressed tables, where each page is compressed using zlib. This allows to compress data that is shared between rows, but that only covers the values in a particular (1 KB – 8 KB page). We actually have this feature, compression of pages inside RavenDB. This is used to store map/reduce values and can really help, because many map/reduce results are inherently very similar to one another. They are also likely to change independently and we rely on the B+Tree structure of the data to process the map/reduce indexes.

Out of the available libraries and algorithms, the Zstd library is the one I selected. This is because it is one of the fastest options while giving great compression ratios. Lz4, which is something that we already use quite extensively, is faster, but it has worse compression ratio and it is lacking a crucial feature, the ability to train the compression algorithm. Why is that important? It is important because our scenario is compressing of a lot of small (usually similar) documents, not a massive corpus all at once.

If we can train the algorithm on the documents, we can get great benefits from removing redundancies across documents. The question is how exactly to manage this. The key problem is that we need to handle data changing over time and sharing of resources. Here is how it works:

  • You can mark certain collections (and revisions) as compressed. This is a setting that you can toggle on and off at will.
  • When RavenDB is writing a document to a compressed collection, it will look up the current dictionary for this collection and compress the document using that dictionary.
    • The first few documents will be compressed with no dictionary, independently.
  • We measure the compression ratio of the values and once the compression ratio exceed the appropriate tolerances we will evaluate the last 256 documents on that collection and train a new dictionary.
    • If the new dictionary compression ratio is better than the existing one (for the new document), we’ll use that from now on.

What ends up happening is that as you write documents into a compressed collection, RavenDB watches your data and learn how to best compress it. The more you write, the more information RavenDB has to find the optimal dictionary to compress your data. This way, we are able to individually compress and decompress documents, while still retaining great compression rates.

There are a lot of details that I’m not getting into, because they aren’t that interesting from the outside world. I might do a webinar on that to explain them in detail, things like how RavenDB decide to re-train, how do we handle recovery of data in the case of hardware failure, etc. But the end result is really nice.

Here are the results from some of the tests we run.

My Blog, with 25,725 docs and 30,232 revisions takes 380.24 MB without compression and it takes 4 seconds to load it to an empty database.

With compression, the time taken soars to 29 seconds (725% higher!), but the disk space drops to 208.85 MB (54%). Note that my blog is a very small dataset, so it is usually not a good candidate from compression. The reason that we see such a major slowdown is probably because we are paying the cost to train on the data (which is expensive) but we don’t have enough writes to amortize these costs.

Let’s see some of the results with larger datasets.

Production dataset, composed of 2,654,072 documents and then 2,803,947 writes to those documents. This took 9 minutes and 23 seconds and 5.98 GB.

This is an interesting test, because what we have here is a totally different test. Before, I was testing raw write speed. Here, most of the time is actually spent in handling updates.

With compression, the time it took was 9 minutes and 58 seconds. So now we have 6% increase in the write time. Note that here we are talking about a speed difference that isn’t truly meaningful. I have seen it swing the other way in these benchmarks. It is possible that other things that happened on the machine impacted this. At any rate, this is really close.

What about the compressed size? Well, we now have: 3.79 GB, we got it down to 63%. This is a bit more impressive than the numbers actually tell. This particular data set contains 1.73GB of data that we don’t compress (it isn’t documents or revisions).

The largest collection had the following changes:

Before After % Original

3.32 GB

1.25 GB

37%

This is good, but I think that there is still some room for tuning here. We’ll look into that after the feature is stabilized.

The last test that I run was to check the Stack Overflow dataset. This is a dump of the Stack Overflow data which provides both significant data size and real world data. Loading the dataset to RavenDB without compression yields the following numbers:

  • A total of 18,338,102 documents loaded in 7 minutes and 58 seconds.
  • The size on disk is: 51.46 GB

As for the compressed version?

  • Loading time was 12 minutes, 40 seconds – 158% slower
  • The size on disk, however, was: 21.39 GB – 41% of the original.

Those are good numbers, given the fact that we have these ingest rates:

  • Uncompressed: 38, 364 docs / sec
  • Compressed: 24,129 docs / sec

In most cases, these high rate of inserts are going to be rare. And there is a lot of capacity here for normal workloads.

So far I talked only about write times, but what are the costs on reads? A simple way to look into the cost is to index the data. This forces RavenDB to access all the data in the relevant collection, so that gives us a good test.

On my production dataset, without compression, a simple index was clocked at:

image

Total indexing time: 1 minute, 50 seconds.

With compression, the same index was clocked at:

image

Total indexing time: 1 minute, 36 seconds.

This is not a mistake. We are actually seeing the compressed portion as faster. The reason for this is simple, the cost of I/O. In this case, the uncompressed indexing had to read 3.32 GB from disk while the compressed version had to read a third of that. It turns out that this matters, a lot, and that it has a huge impact on the overall time.

Doing the same testing on Stack Overflow dataset, I created an index covering 12 million of those documents, and I clocked the uncompressed version at:
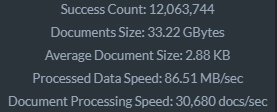
image

Total time to index the data (this particular collection stands at 47.32 GB) was: 7 minutes, 2 seconds.

The compressed database, on the other hand, had to deal with just 18.76 GB of data, but proceeded at a much slow rate, about 7,000 docs/sec. I’m pretty sure that the underlying reason is that we have enough data and we are indexing it quickly enough and in big enough batches to start seeing memory allocations issues. In fact, I was able to confirm that. Here is the output from RavenDB:
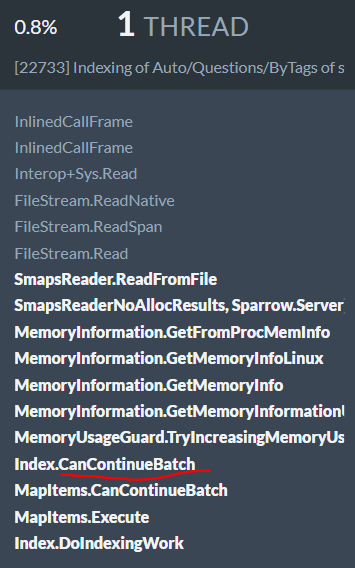
image

What we can see here is that we are blowing the memory budget for the index. Whenever we do that, we have to take into account the state of the system, to figure out if we need to stop the current batch and release resources. In this case, we are paying for that by checking every 16 MB of allocated memory. Given average document size of 2.88 KB, that means that we need to run this (not inexpensive) check once every 6,000 documents or so. Once we fix that, I hope to see much greater numbers.

However, remember that the whole point here is to trade CPU time for disk space. We certainly see the space savings here, so it isn’t surprising that this is has an impact on performance.

A quick test of random reads throughout the Stack Overflow database also shows the impact, but on the other direction. I’m running these tests on a dedicated machine with 32 GB of RAM.

When using compressed database, I can reach 95,000 reads / sec. When using uncompressed data, I can only reach a maximum of 85,000 reads / sec. The size of the collection I’m querying exceeds the size of the RAM when it isn’t compressed, so I think that at least part of that is related to the difference in IO costs.

When running queries for both compressed and uncompressed in parallel (so they have to fight for the memory), I can see that the compressed database has a 1,500 – 2,500 reads / sec advantage over the uncompressed database.

In short, all of this lead to a good set of rules of thumbs. Compression makes write somewhat slower, it is currently (but we’ll be fixing that, probably by the time you read this post) make indexing somewhat slower, but queries and reads tend to be faster due to reduced I/O.

The space savings can range between one half to two thirds of your data. If you care about disk space, especially if you have a dataset where many of your documents are only touched for a while and then mostly are rarely touched, this is a good fit for you.

We intend to make this an experimental feature in RavenDB 5.0, get some field testing in the real world on this and graduate this to on by default in future releases.

As usual, you feedback is critical and I would greatly appreciate it.

time to read 2 min | 287 words

When you have error code model for returning errors, you are going to be fairly limited in how you can report actual issues.

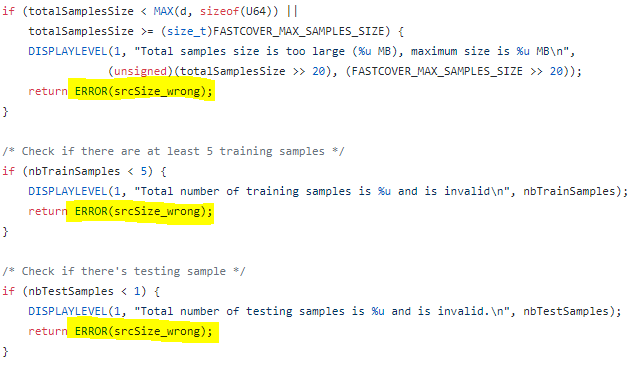
Here is a good example, taken from the ZStd source code:

image

You can see that the resulting error is the same, but we have three very different errors. Well, to be fair, we have two types of errors.

The total size is wrong and the number of samples is either too big or too small. There is no way to express that to the calling code, which may be far higher in the stack. There is just: “The source size is wrong” error.

There is actually an attempt at proper error reporting. The DISPLAYLEVEL is a way to report more information about the error, but like any C library, we are talking about creating custom error reporting. The DISPLAYLEVEL macro will write to the standard output if a flag is set. That flag is impossible to be set from outside the compilation unit, as far as I can see. So consuming this from managed code means that I have to just guess what these things are.

You can say a lot about the dangers and complexities of exceptions. But having a good way to report complex errors to the caller is very important. Note that in this case, complex means an arbitrary string generated at error time, not a complex object. An error code is great if you need to handle the error. But if you need to show it to the user, log it or handle it after the fact, a good clear error message is the key.

time to read 3 min | 588 words

I run into this blog post talking about using a real programming language for defining your configuration. I couldn’t agree more, I wrote about it 15 years ago. In fact, I agree so much I wrote a whole book about the topic.

Configuration is fairly simple, on its face. You need to pass some values to a program to execute. In the simplest form, you simple have a map of strings. If you need hierarchy, you can use dots (.) or slashes (/) for readability. A good example is:

As the original blog post notes, you also need to have comments in the format, if the file is meant to be human readable / editable. From that format, you can transform it to the desired result.  Other formats, such as JSON / YAML / XML are effectively all variations on the same thing.

Note that configuration usually takes a non trivial amount of work to properly read. In particular if you have to run validations. For example, the port above, must be greater than 1024 and less than 16,384. The log’s level can be either a numeric value or a small set of terms, etc.

The original post talked a lot about reusing configuration, which is interesting. Here is a blog post from 2007 showing exactly that purpose. I’m using a look to configure an IoC Container dynamically:

However, after doing similar things for a long while, I think that the most important aspect of this kind of capability has been missed. It isn’t about being able to loop in your configuration. That is certainly nice, but it isn’t the killer feature. The killer feature is that you don’t need to have complex configuration subsystem.

In the case above, you can see that we are doing dynamic type discovery. I can do that in the INI example by specifying something like:

I would need to go ahead and write all the discovery code in the app. And the kind of things that I can do here are fixed. I can’t manage them on the fly and change them per configuration.

Here is another good example, passwords. In the most basic form, you can store passwords in plain text inside your configuration files. That is… not generally a good thing. So you might put them in a separate file. Or maybe use DPAPI on Windows to secure them. Something like this:

I have to write separate code for each one of those options. Now, I get a requirement that I need to use Azure Vault in one customer. And in another, they use a Hardware Security Module that we have to integrate with, etc.

Instead of having to do it all in the software, I can push that kind of behavior to the configuration. The script we’ll run can run arbitrary operations to gather its data, including custom stuff defined on site for the specific use case.

That gives you a lot of power, especially when you get a list of integrations options that you have to work with. Not doing that is huge.  That is how RavenDB works, allowing you to shell out to a script for specific values. It means that we have a lot less work to do inside of RavenDB.

With RavenDB, we have gone with a hybrid approach. For most things, you define the configuration using simple JSON file, and we allow you to shell out to scripts for the more complex / dynamic features. That ends up being quite nice to use and work with.

time to read 1 min | 121 words

The webinar has been published and you can watch it here.

We are conducting this webinar in the ultimate distributed environment.

The new coronavirus economy demands that we work in a distributed manner. Companies the world over are revamping their remote work infrastructure, setting the building blocks for even more distributed systems.

The demand for working in a distributed environment will only increase, as will the need to use a database that is best suited to it.

From day one, RavenDB has always been a distributed database. As a document database, it's reduced fundamental complexity in processing raw data makes it ideal for such distributed functions like data replication and supporting a microservices architecture.

FUTURE POSTS

  1. Partial writes, IO_Uring and safety - about one day from now
  2. Configuration values & Escape hatches - 5 days from now
  3. What happens when a sparse file allocation fails? - 7 days from now
  4. NTFS has an emergency stash of disk space - 9 days from now
  5. Challenge: Giving file system developer ulcer - 12 days from now

And 4 more posts are pending...

There are posts all the way to Feb 17, 2025

RECENT SERIES

  1. Challenge (77):
    20 Jan 2025 - What does this code do?
  2. Answer (13):
    22 Jan 2025 - What does this code do?
  3. Production post-mortem (2):
    17 Jan 2025 - Inspecting ourselves to death
  4. Performance discovery (2):
    10 Jan 2025 - IOPS vs. IOPS
View all series

Syndication

Main feed Feed Stats
Comments feed   Comments Feed Stats
}