Raccoon Blog Performance
Update: See below for details about the server load.
I just run into this tweet:
That isn’t the first time that we heard this, and it is actually surprising, not only was there no attention to performance given throughout the lifecycle of the project so far, we actually discovered some issues that theoretically should hurt performance.
The secret is that RavenDB is really good in optimizing itself based on usage patterns. That came out of the realization that we had to drop people into the Pit of Success as much as possible. Raccoon Blog shows that we were able to do just that.
Please note that I am testing this with a RavenDB server over the internet, to emphasis the actual costs involved.
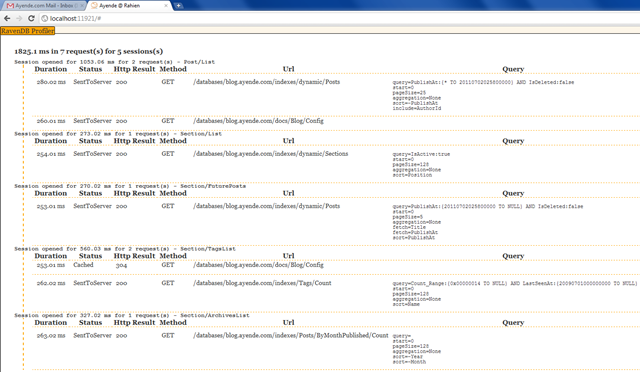
For example, let us look at the current state of this blog, using RavenDB MVC Profiler:
Just to be clear, in order to actually show the problem, I am running this locally, while the RavenDB server is actually the production RavenDB server for this blog, in other words, the vast majority of the time is actually network traffic, making queries to RavenDB over the Internet.
Remember that I said that we didn’t pay attention to performance? Notice how many remote queries we are making. We have 5 sessions and 7 queries. Why is that?
The reason for that is that we are using the Session per Action approach for scoping the session, and we make heavy use of Child Actions, each of which is going to get its own session. Give me a moment to fix that…
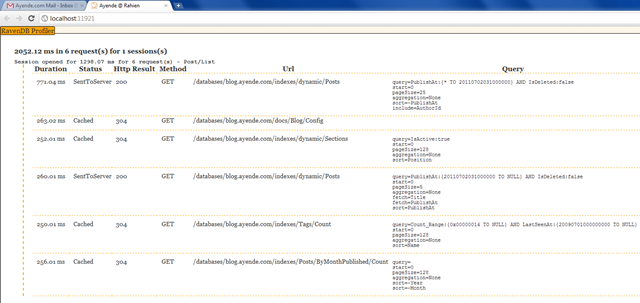
Well, that took three minutes, mostly because I wanted to do it right. There are advantages for Infrastructure Ignorance, and one of them is the ease in which we can make such changes.
The change isn’t drastic, we went from having 5 sessions and 7 requests to 1 session and 6 requests, in the post details view, however, it saved us two requests.
The actual cost of opening a session is essentially zero, so it is more the requests that we are making than anything else. We can improve performance even further by applying additional tactics, such as aggressive caching or batched calls, but we will save those for another post.
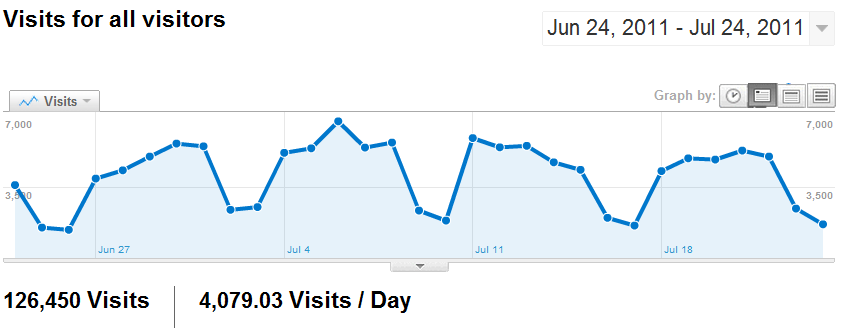
Update: I was asked about the load, and I hopped off to Google Analytics and got a few numbers:
That isn’t super high, but it is respectable.


Comments
Just wondering if you could share how you managed to get the 5 sessions and 7 requests to 1 session and 6 requests? I've been trying to get rid of this since I seen the warning in NHProf.
Calum,
That was mostly because we moved to a session per request, which included all of the child sessions, vs a session per action, which created a session per action.
The benefit is that we now have better first level caching.
Ah of course... thanks ayende.
I am curious - what kind of load is the web server under? Have you published usage stats anywhere? I am wondering where the bottlenecks are in the system.
Aidan,
I updated the post to include server analytics
Ayende,
I could not find any changes in the latest RaccoonBlog commits to github. The RavenActionFilterAttribute already did a check for child-actions. What has changed?
David,
Take a look at when this was posted. :-)
That change happen a LONG while ago
Ayende,
That's great - thanks. Do you know of anyone who is using RavenDB in high traffic applications and sharing their experiences? Kind of like the Stack Overflow guys are doing with their application stack - http://highscalability.com/blog/2011/3/3/stack-overflow-architecture-update-now-at-95-million-page-vi.html
Hm.. I think everybody are wrong - ayendes blog performance is realy terrible, it cant process more than 20 posts in half month :)
That is impressive. 'Ludicrous' is not far off it.
Aidan,
Not yet, I am afraid.
Your current/live profiler has rounding errors.
See ie 37ms 12 requests vs session opened for 0ms for 12 requests.
Also most requests are rounded to 1ms which would make a Total of more than 37ms.
While your posted image contains ms up to 2 digits after the separator.
// Ryan
Ryan,
Yes, we are aware of that. We are trying to give you an estimate that you can use to figure things out, not actual hard numbers.
At those levels, it is actually pretty hard to get accurate numbers, too
Do you plan on providing hosted version of Racoon blog for some fee?
Giorgi,
Of Raccon Blog? No, not at this time
Comment preview