What is new in RavenDB 3.5Monitoring active I/O operations
RavenDB 3.5 have just a few of major monitoring features (although wait for the next one, it is a biggie), but this one is a pretty important one.
This feature allows RavenDB to track, at a very detailed level, all the I/O work that is done by the server, and give you accurate information about what exactly is going on with the system.
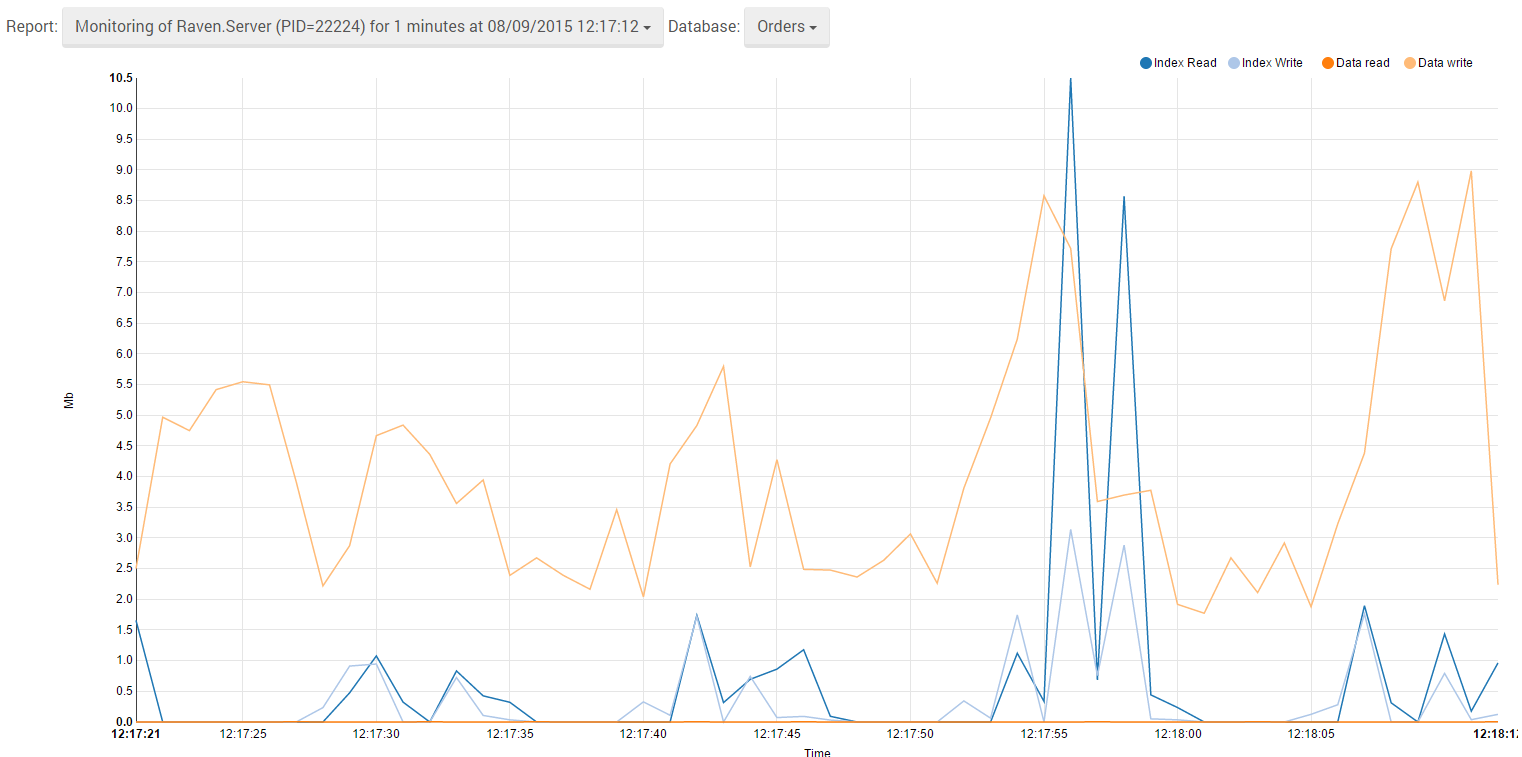
Take a look at this report:
As you can see, you see a one minute usage, with writes going on and some indexing work along the way.
The idea here is that you can narrow down any bottlenecks that you have in the system. Not only by looking at the raw I/O stats that the OS provides, but actually be able to narrow it down to a particular database and a particular action inside that database. For users with multi tenants databases, this can be a very useful tool in figuring out what is actually going on in their system.
The mechanics behind this report are actually interesting. We are using ETW to capture the I/O rates, but since we are capturing kernel events, that require admin privileges. Typically, RavenDB isn’t run with those privileges. To work around that, the admin is going to run the Raven.Monitor.exe process, in an elevated context. That gives us access to the kernel events, and we then process the information and show them to the user in the studio.
More posts in "What is new in RavenDB 3.5" series:
- (12 Aug 2015) Monitoring support
- (11 Aug 2015) Monitoring active I/O operations
- (10 Aug 2015) Filters & transformers with RavenDB Replication
- (06 Aug 2015) Collection Specific Replication
- (15 Jul 2015) Exploring data in the dark
- (14 Jul 2015) My thread pool is smarter
- (10 Jul 2015) Smuggling data across servers


Comments
Comment preview