Oren Eini

CEO of RavenDB

a NoSQL Open Source Document Database

Get in touch with me:

oren@ravendb.net +972 52-548-6969

Posts: 7,546
|
Comments: 51,162
Privacy Policy · Terms
filter by tags archive
time to read 2 min | 333 words

The final monitoring feature in RavenDB 3.5 is SNMP support. For those of you who aren’t aware, SNMP stands for Simple Network Management Protocol. It is used primarily for monitoring network services. And with RavenDB 3.5, we have full support for it. We even registered our own root OID for all RavenDB work (1.3.6.1.4.1.45751, if anyone cares at this stage). We have also setup a test server where you can look at the result on SNMP support in RavenDB 3.5 (login as guest to see details).

But what is this about?

Basically, a lot of monitoring features that we looked at boiled down to re-implementing enterprise monitoring tools that are already out there. Using SNMP gives all those tools direct access to the internal details of RavenDB, and allow you to plot and manage them using your favorite monitoring tools. From Zabbix to OpenView to MS MOM.

We expose a long list of metrics, from the loaded databases to the number of indexes items per second to the ingest rate to the number of queries to how much storage space each database takes to…

Well, you can just go ahead and read the whole list and go over it.

We are still going to put effort into making figuring out what is going on with RavenDB directly from the studio, but as customers start running large numbers of RavenDB instances, it becomes unpractical to deal with each of them individually. That is why using a monitoring system that can watch many servers is preferable. You can also set it up to send alerts when certain threshold is reached, and… those are now features that aren’t RavenDB features, those are your monitoring system features.

Being able to just off load all of those features is great, because we can just expose the values to the monitoring tools and go on to focus on other stuff, rather than just have to do the full monitoring work, UI, configuration, alerts, etc.

time to read 2 min | 265 words

RavenDB 3.5 have just a few of major monitoring features (although wait for the next one, it is a biggie), but this one is a pretty important one.

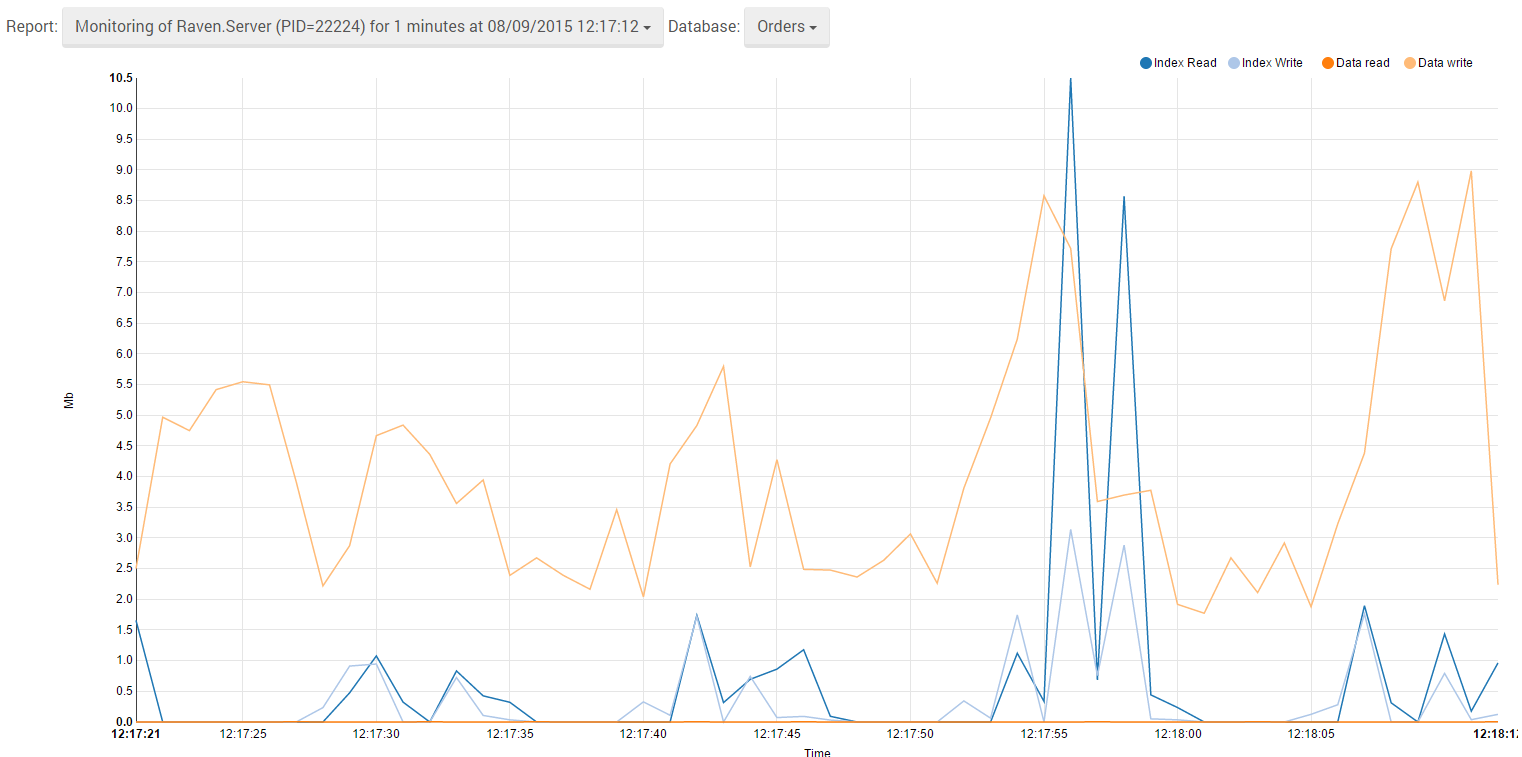
This feature allows RavenDB to track, at a very detailed level, all the I/O work that is done by the server, and give you accurate information about what exactly is going on with the system.

Take a look at this report:

image

As you can see, you see a one minute usage, with writes going on and some indexing work along the way.

The idea here is that you can narrow down any bottlenecks that you have in the system. Not only by looking at the raw I/O stats that the OS provides, but actually be able to narrow it down to a particular database and a particular action inside that database. For users with multi tenants databases, this can be a very useful tool in figuring out what is actually going on in their system.

The mechanics behind this report are actually interesting. We are using ETW to capture the I/O rates, but since we are capturing kernel events, that require admin privileges. Typically, RavenDB isn’t run with those privileges. To work around that, the admin is going to run the Raven.Monitor.exe process, in an elevated context. That gives us access to the kernel events, and we then process the information and show them to the user in the studio.

time to read 1 min | 166 words

In the previous post, I introduced RavenDB Collection Specific Replication. This allows you to filter which collections you’ll get to replicate.

The next step is to apply filters and transformers along the way. For example, like so:

image

As you can see, the transformation script allows us to modify the outgoing data, in this case, to hide the email address.

This feature is primarily intended for data replication back to staging / development environment, where you have the need to have the data, but can’t expose some of it outside.

It can also be used to modify details going to slave databases so we’ll have per database values (for example, striping details that are not relevant for a particular tenant).

Like Collection Specific Replication, this replication destination will not be considered to be a failover target.

time to read 2 min | 349 words

With RavenDB 3.5, we added a really cool feature to the RavenDB Replication. Actually, I’m not sure how much of a “feature” this is, because this actually take away capabilities Smile.

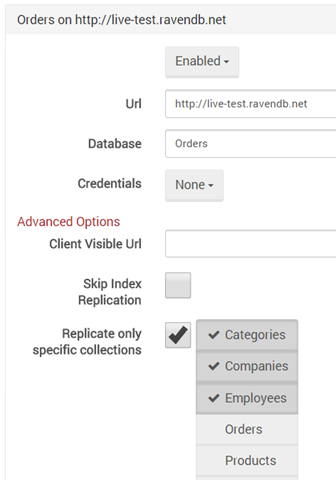
As the name suggest, this allows you to select specific collections and only replicate those to a specific destination. For example, in this example, we can see that we are only replicating the Categories, Companies and Employees collection, instead of replicating the entire database.

image

Why is this important?

Because it opens up new ways of managing your data. It allows you to use RavenDB replication (high throughput, reliable and error resilient) to manage data distribution.

Let us imagine for a moment that we have a web ordering system, with multiple tenants. And we have some common information that needs to be shared among all the tenants. For example, the baseline pricing information.

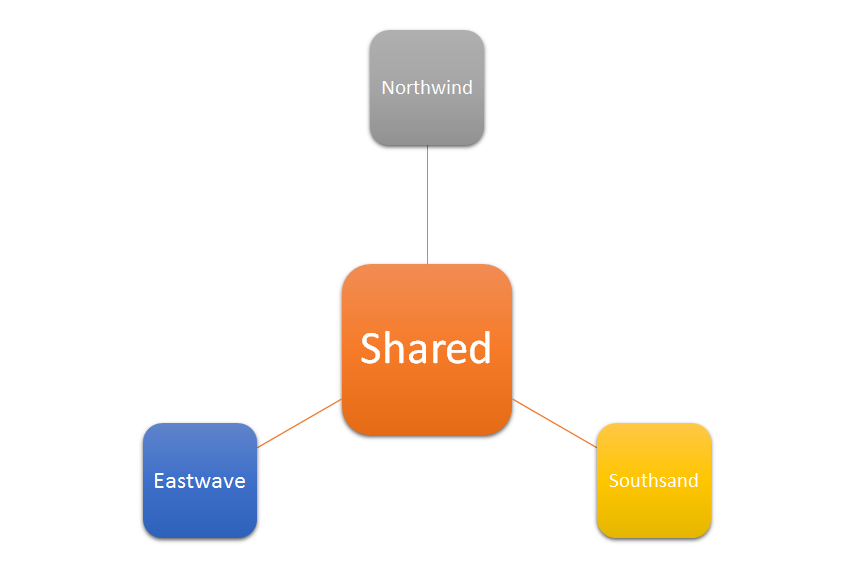
We can setup replication like so:

image

The Shared database contains a lot of information, but only the pricing information is replicated. This means that you can change it once, and it will propagate to all the end destinations on its own.

Common scenarios for such shared data include:

  • Users /logins
  • Base data for local modifications (product catalog that each tenant can override)
  • Rules

Note that because we are using collection specific replication, this does not make the destination database into a duplicate of the source. As such, it will not take part in failover configuration for the source database.

You can mix and match, a single database can replicate to failover destination (full replication) and partial (only specific collections). And the clients will know how to fail to the right node if something bad happens.

time to read 1 min | 188 words

One of the things that tend to happen a lot when we are developing with a database is that we need to peek at the data, and a lot of the time, just looking at the data one document at a time isn’t good for us.

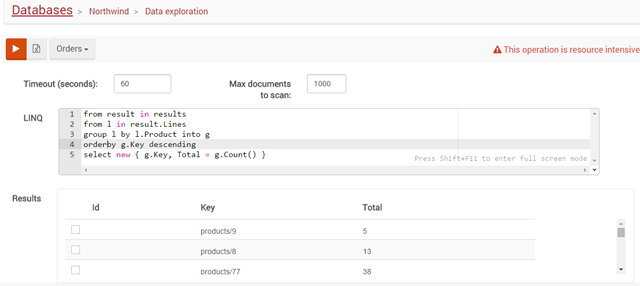
We noticed that a lot of users will create temporary indexes (usually map/reduce ones) to get some idea about what is actually going on in the database, or for one off reporting. That is pretty inefficient, and in order to handle that, we added the Data Exploration feature.

image


This feature gives you the option of exploring the data in details. You can even run the query over large data sets, doing some complex aggregations and looking at the results.

Note that this is an admin / developer only feature, we provide no API for this, because the idea is that we have a human sitting in front of the DB going… “Hmm.. I wonder about…”

time to read 4 min | 671 words

The .NET thread pool is a really amazing piece of technology, and it is suitable for a wide range of usages. RavenDB has been making use of it for almost of all concurrent work since the very beginning.

In RavenDB 3.5, we have decided to change that. RavenDB have a lot of parallel execution requirements, but most of them have unique characteristics that we can express better with our own thread pool.

To start with, unlike the normal thread pool, we aren’t registering just a delegate and some state for it to execute, we are always registering a list of items to process, and a delegate that takes either a single item from that list or a section of that list. This let us do a much better job at work stealing. Because we have a lot more context about the actual operation. We know that when we are done with executing a particular delegate, we get to run the same delegate on the next available item in the list that it got passed it. That give us higher locality of code, because we are always executing the same task, as long as we have tasks for that in the pool.

We often have nested operations, a parallel task (execute indexing work) that spawn additional parallel work (index the following documents). By basing this all on our custom thread pool, we can perform those operations in a way that doesn’t involve waiting for that work to be done. Instead, the thread pool thread that we run on is able to “wait” by executing the work that we are waiting for. We have no blocked threads, and in many cases we can avoid getting any context switches.

Under load, that means that threads won’t put a lot of work on the thread pool and then have to fight with each other over who will finish its work first, it means that we get to run our own tasks, and only when there are enough threads available for other word will we spread for additional threads.

Speaking of load, the new thread pool also have dynamic load balancing feature. Because we know that RavenDB will use the thread pool for background work only, we can prioritize things accordingly. RavenDB is trying to keep the CPU usage in the 60% – 80% range by default. And if we detect that we have a higher CPU usage, we’ll start decreasing the background work we are doing, to make sure that we aren’t impacting front row work (like serving requests). We’ll start doing that by changing the priority of the background threads, and eventually just stop processing work in most of the background threads (we always have a minimum number of threads that will remain working, of course).

Another fun thing that the thread pool can do is to detect and handle slowpokes. A common example is an index that is taking a long time to run. Significantly more than all the other indexes. The thread pool can release all the other indexes, and let the calling code know that this particular task has been left to run on its own. RavenDB will then split the indexing work so the slow index will not slow all of the rest of the indexing.

And having split the thread pools between front row work (the standard .NET thread pool) doing request processing and the background pool (which is our own custom impl), we get a lot more predictability in the environment. We don’t have to worry about indexing jobs taking over the threads required to serve requests, or for requests on the server to impact the loading of a new database, etc.

And finally, like every other feature in RavenDB nowadays, we have a rich set of debug endpoints that can tell us in details exactly what is going on. That is crucial when we are talking about systems that run for months and years or when we are trying to troubleshoot a problematic server.

time to read 1 min | 183 words

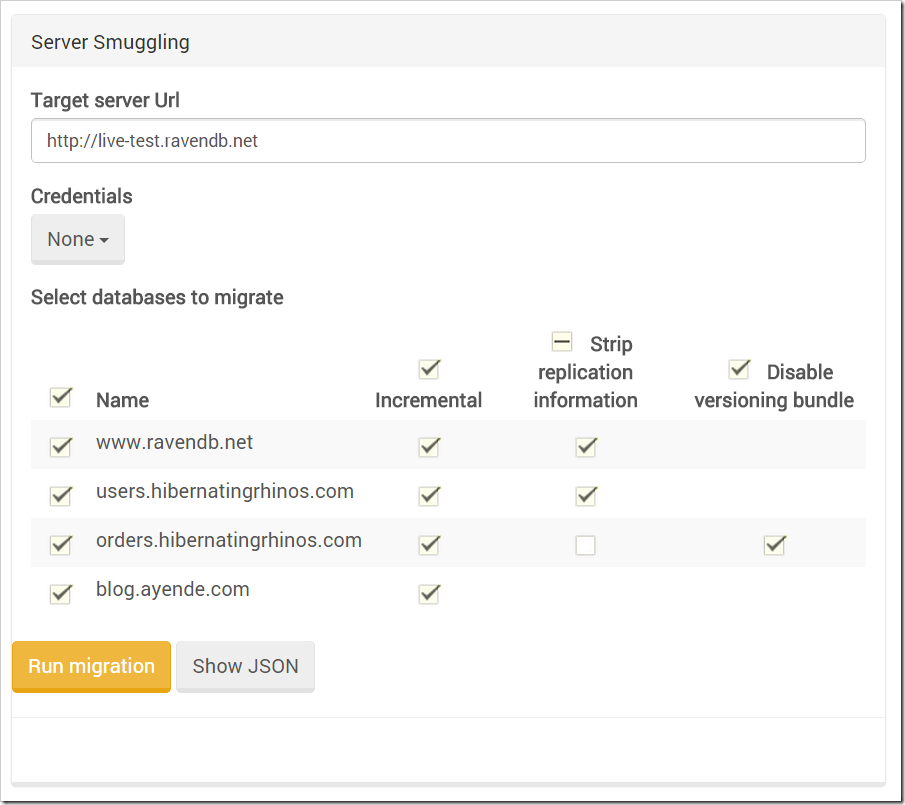
This feature is meant primarily for users that work with multiple instances of RavenDB. The common scenario is production/staging/development and needing to move data around between them. Previously, you would have to manually move data using import or export, or set a bunch of scripts to run the smuggler with the right commands.

In RavenDB 3.5, we have turned that into a full fledged feature.

image

The nice thing about this, you can just set it up as you want, with the right databases and configuration that you need to send. By default we use incremental option, so you can run this over time and only get the new stuff.

The idea is that you can use this to move the data from one environment to the next. You can also click on the Show JSON button and get the data you need to script this (across all dbs) in an automated (and possibly scheduled) manner.

FUTURE POSTS

  1. Partial writes, IO_Uring and safety - about one day from now
  2. Configuration values & Escape hatches - 4 days from now
  3. What happens when a sparse file allocation fails? - 6 days from now
  4. NTFS has an emergency stash of disk space - 8 days from now
  5. Challenge: Giving file system developer ulcer - 11 days from now

And 4 more posts are pending...

There are posts all the way to Feb 17, 2025

RECENT SERIES

  1. Challenge (77):
    20 Jan 2025 - What does this code do?
  2. Answer (13):
    22 Jan 2025 - What does this code do?
  3. Production post-mortem (2):
    17 Jan 2025 - Inspecting ourselves to death
  4. Performance discovery (2):
    10 Jan 2025 - IOPS vs. IOPS
View all series

Syndication

Main feed Feed Stats
Comments feed   Comments Feed Stats
}