What is new in RavenDB 3.0Operations–the pretty pictures tour
This has been the most important change in RavenDB 3.0, in my opinion. Not because of complexity and scope, pretty much everything here is much simpler than other features than we have done. But this is important because it makes RavenDB much easier to operate. Since the get go, we have tried to make sure that RavenDB would be a low friction system. We usually focused on the developer experience, and that showed when we had to deal with operational issues.
Things were more complex than they should. Now, to be fair, we had the appropriate facilities to figure things out, ranging from debug endpoints, to performance counters to a great debug log story. The problem is that in my eye, we were merely on par with other systems. RavenDB wasn’t created to be on par, RavenDB was created so when you use this, you would sigh and say “that is how it should be done”. With RavenDB 3.0, I think we are much closer to that.
Because we have done so much work here, I’m going to split things to multiple posts. This one is the one with all the pretty pictures, as you can imagine. Next one will talk about the actual operational behavior changes we made.
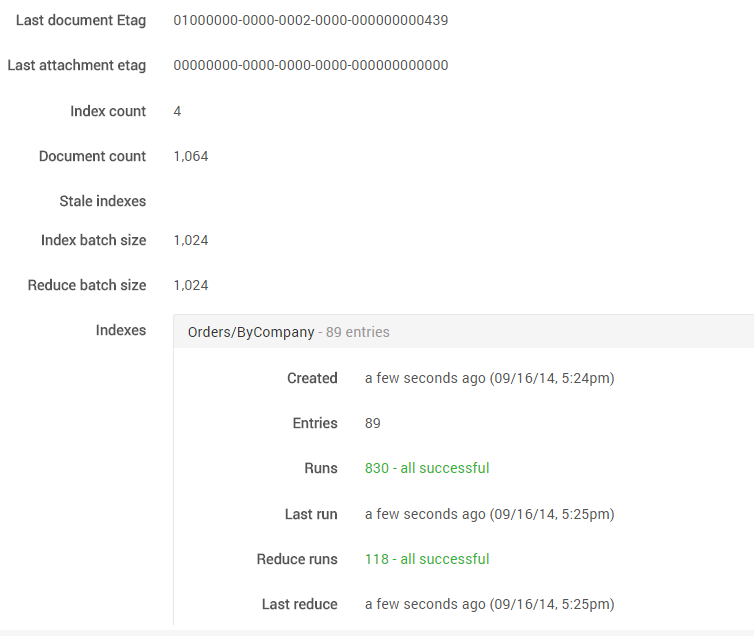
Let me go over some of those things with you. Here you can see the stats view, including looking at an index details.
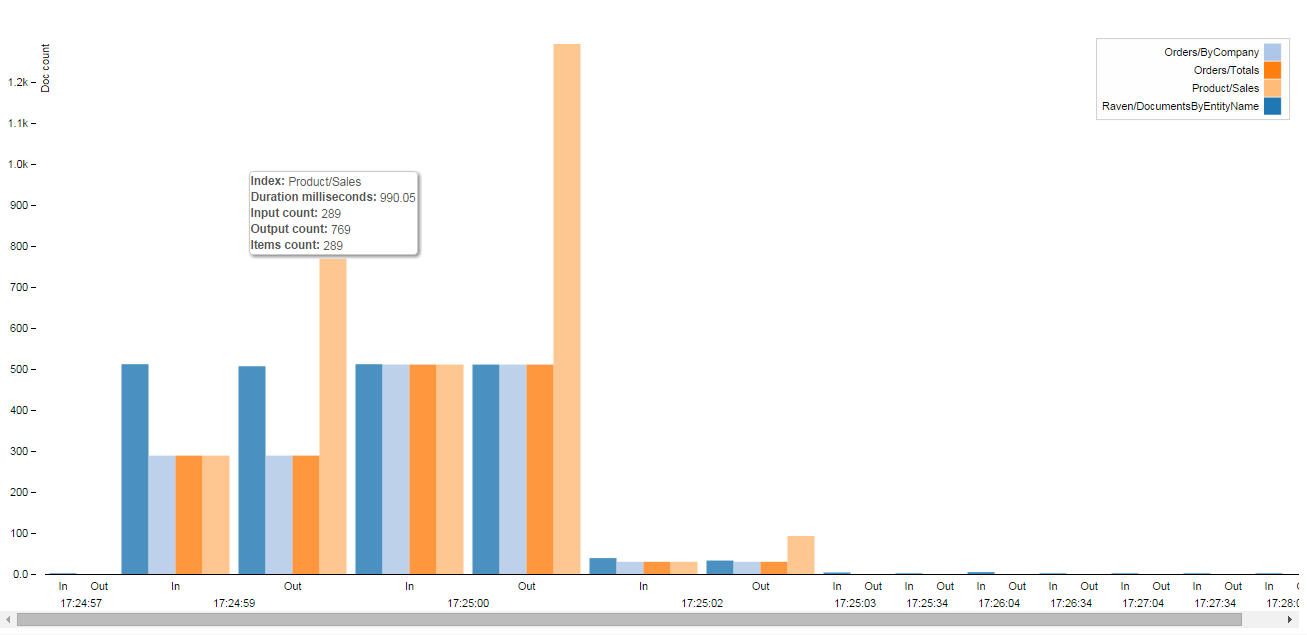
That is similar to what we had before. But it gets interesting when we want to start actually looking at the data more deeply. Here are the indexing stats on my machine:
You can see that the Product/Sales index has a big fanout, by the fact that it has more items out than in, for example. You can also see how much items we indexed per batch, and how we do parallel indexing.
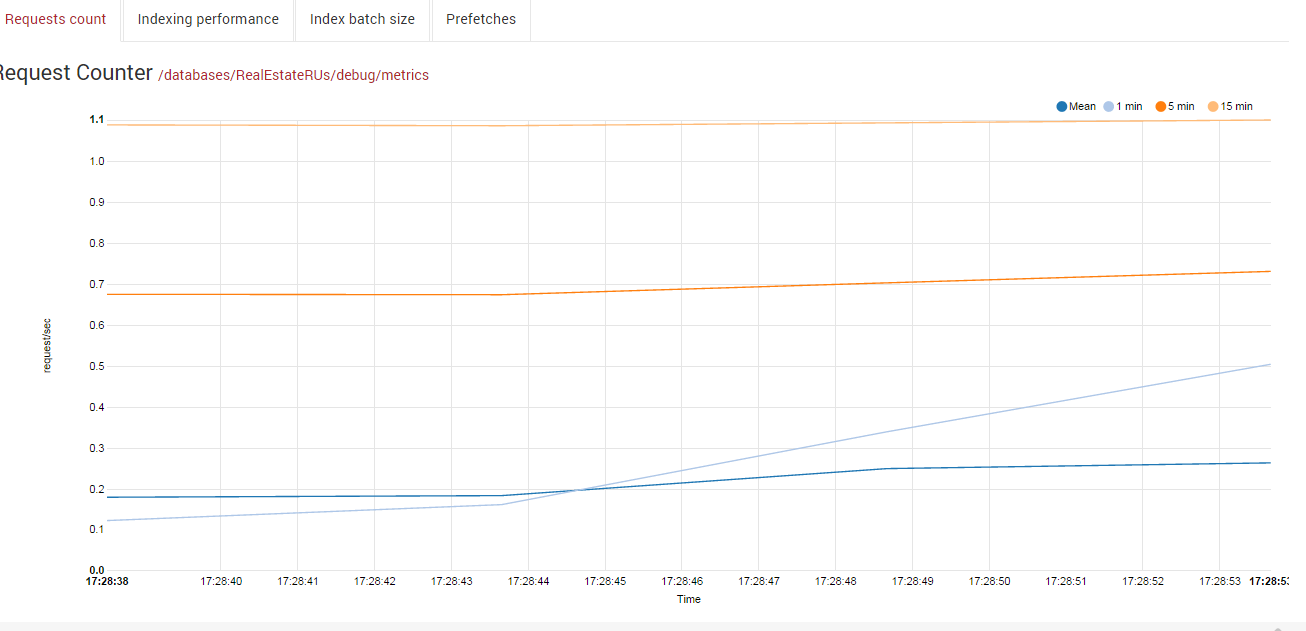
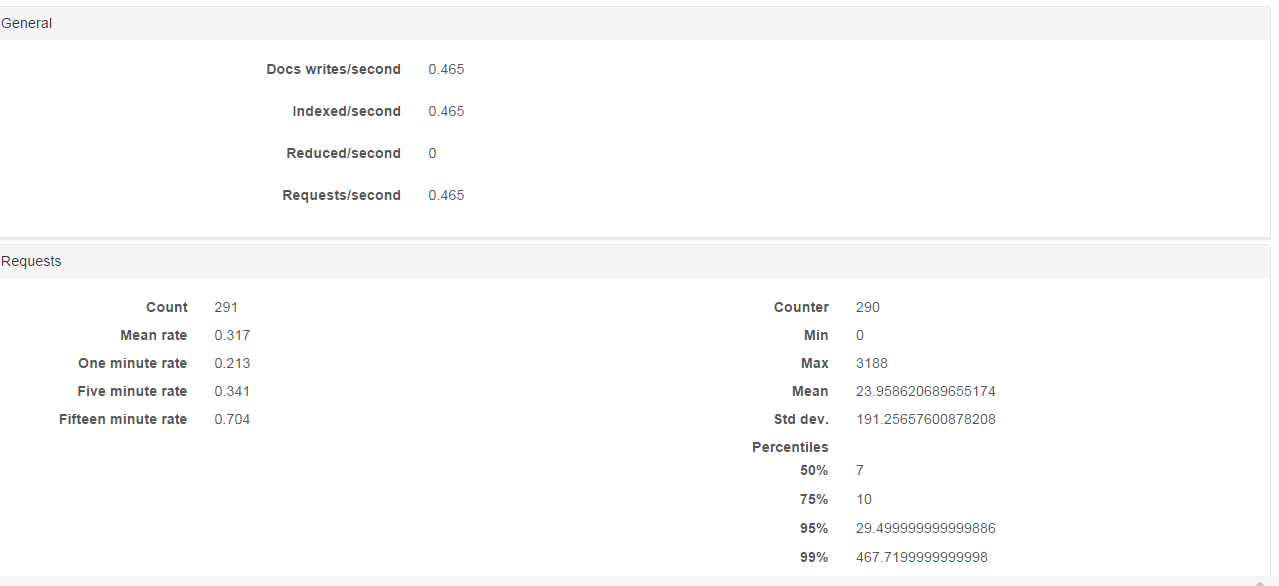
We also have a lot more metrics to look at. The current requests view along several time frames.
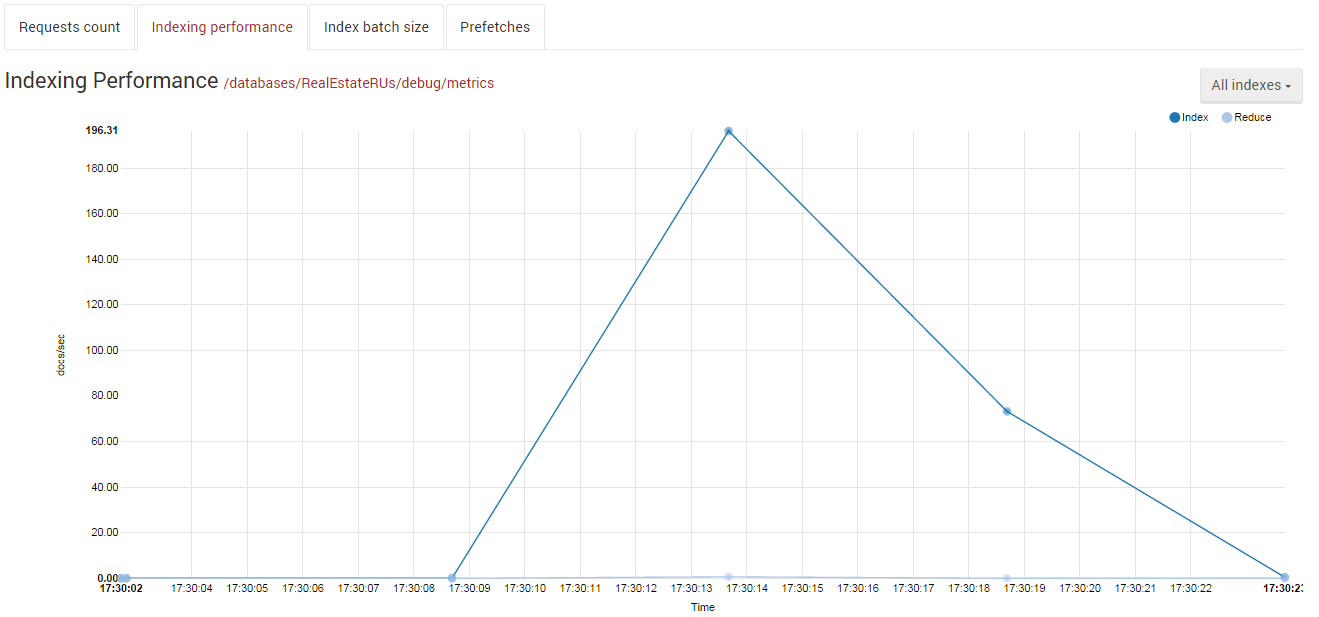
The live index work view:
The indexing batch size and the perfetching stats graph gives us live memory consumption usage for indexing, as well as some view on what indexing strategy is currently in use.
Combining those stats, we have a lot of information at our fingertips, and can get a better idea about what exactly is going on inside RavenDB.
But so far, this is just to look at things, let us see what else we can do. RavenDB does a lot of things in the background. From bulk insert work to set based operations. We added a view that let you see those tasks, and cancel them if you need to:
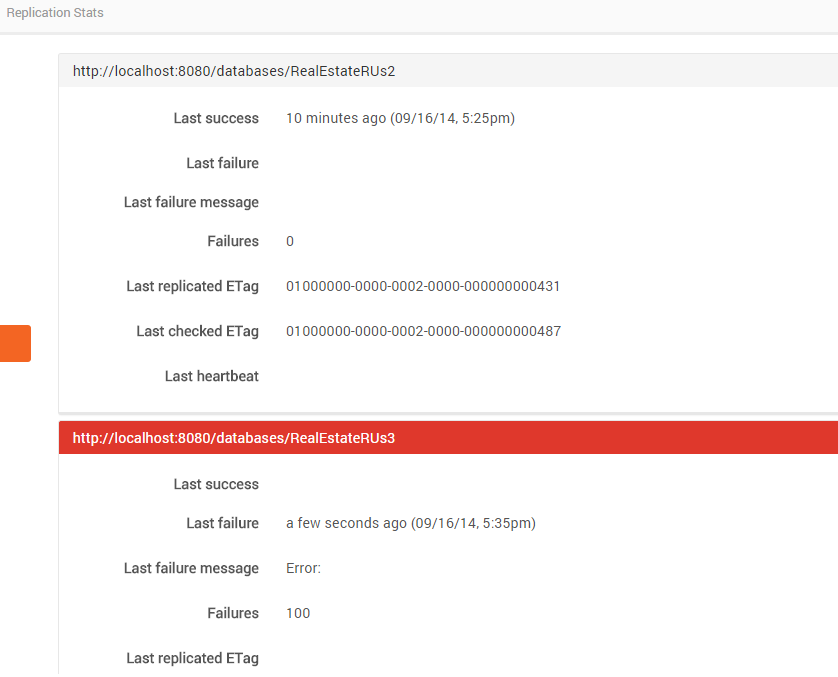
You can now see all the work done by the replication background processes, which will give you a better idea on what your cluster is doing. And of course there is the topology view that we already looked at.
We also added views for most of the debug endpoints that RavenDB has. Here we are looking at the subscribed changes connections.
We get a lot of metrics available for us now. In fact, we went a bit crazy there and started tracking a lot of stuff. This will help you understand what is going on internally. And you can also get nice histograms.
There is a lot of stuff there, so I won’t cover it all, but I would show you what I think is one of the nicest features:
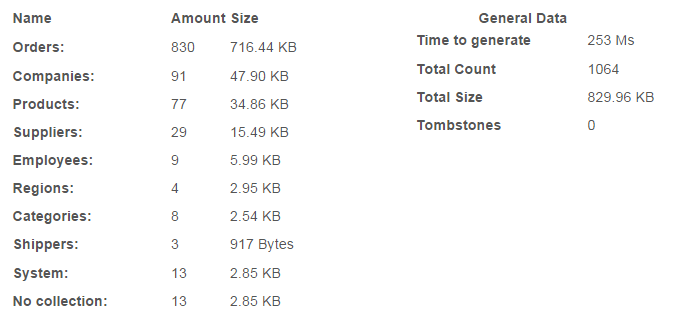
This will give you real stats about resource usage in your system. Including counts of documents per collection and the size on disk.
Okay, that is enough with the pretty pictures, on my next post, I’ll talk about the actual changes we made to support operations better.
More posts in "What is new in RavenDB 3.0" series:
- (24 Sep 2014) Meta discussion
- (23 Sep 2014) Operations–Optimizations
- (22 Sep 2014) Operations–the nitty gritty details
- (22 Sep 2014) Operations–production view
- (19 Sep 2014) Operations–the pretty pictures tour
- (19 Sep 2014) SQL Replication
- (18 Sep 2014) Queries improvements
- (17 Sep 2014) Query diagnostics
- (17 Sep 2014) Indexing enhancements
- (16 Sep 2014) Indexing backend
- (15 Sep 2014) Simplicity
- (15 Sep 2014) JVM Client API
- (12 Sep 2014) Client side
- (11 Sep 2014) The studio
- (11 Sep 2014) RavenFS
- (10 Sep 2014) Voron




Comments
I would say that THAT is the killer feature! Awesome job!
Megaseconds where you mean milliseconds and kb where you mean kib?
Dennis, I don't understand.
I think Dennis's point is that capital M is usually a prefix meaning Mega, whereas conventionally, for milli-, a lower case m is used. So unless in your last screenshot the "Time to generate" is meant to be ~8 years, the prefix letter is wrong.
Comment preview