Oren Eini

CEO of RavenDB

a NoSQL Open Source Document Database

Get in touch with me:

oren@ravendb.net +972 52-548-6969

Posts: 7,546
|
Comments: 51,161
Privacy Policy · Terms
filter by tags archive
time to read 1 min | 130 words

This is a big release, it is a big deal for us.

It took me 18(!) blog posts to discuss just the items that we wanted highlighted, out of over twelve hundred resolved issues and tens of thousands of commits by a pretty large team.

Even at a rate of two posts a day, this still took two weeks to go through.

We are also working on the new book, multiple events coming up as well as laying down the plans for RavenDB vNext. All of this is very exciting, but for now, I want to ask your opinion. Based on the previous posts in this series, and based on your own initial impressions of RavenDB, what do you think?

This is me signing off, quite tired.

time to read 2 min | 223 words

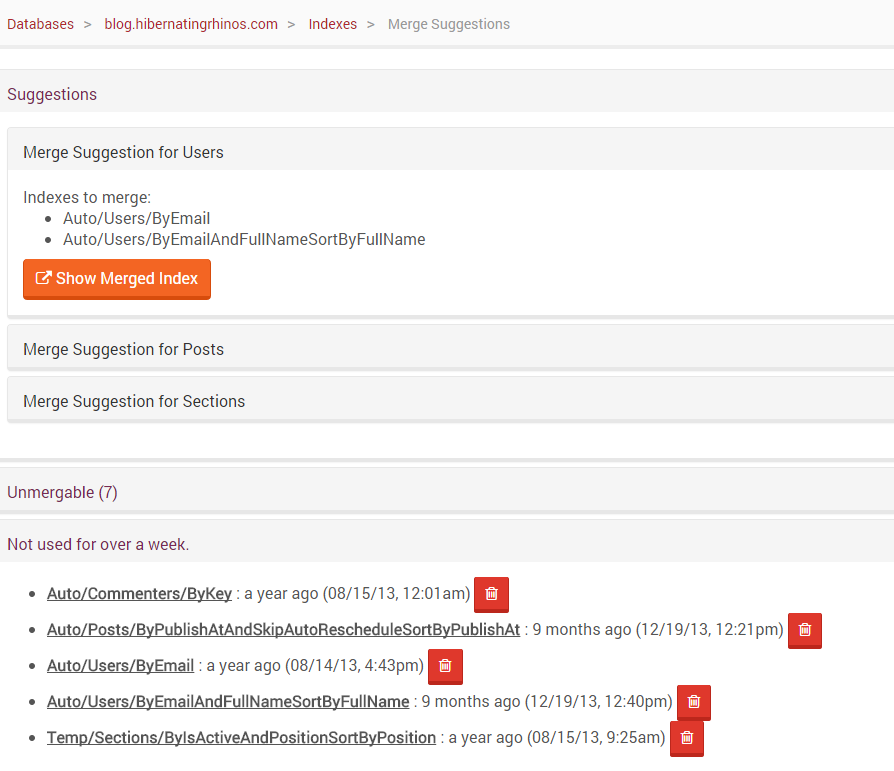
One of the important roles operations has is going to an existing server and checking if everything is fine. This is routine maintenance stuff. It can be things like checking if we have enough disk space for our expected growth, or if we don’t have too many indexes.

Here is some data from this blog’s production system:

image

Note that we have the squeeze button, for when you need to squeeze every bit of perf out of the system. Let us see what happens when I click it (I used a different production db, because this one was already optimized).

Here is what we get:

image

You can see that RavenDB suggest that we’ll merge indexes, so we can reduce the overall number of indexes we have.

We can also see recommendations for deleting unused indexes in general.

The idea is that we keep track of those stats and allow you to make decisions based on those stats. So you don’t have to go by gut feeling or guesses.

time to read 4 min | 643 words

After looking at all the pretty pictures, let us take a look at what we have available for us for behind the cover for ops.

The first such change is abandoning performance counters. In 2.5, we reported a lot of our state through performance counters. However, while they are a standard tool and easy to work with using admin tools, they were also unworkable. We have had multiple times where RavenDB would hang because performance counters were corrupted, they require specific permissions and in general they were a lot of hassle. Instead of relying on performance counters, we are now using the metrics.net package to handle that. This gives us a lot more flexibility. We can now generate a lot more metrics, and we have. All of those are available in the /debug/metrics endpoint, and on the studio as well.

Another major change we did was to consolidate all of the database administration details to a centralized location:

Manage your server gives us all the tools we need to manage the databases on this server.

image

You can manage permissions, backup and restore, watch what is going on and in general do admin style operations.

image

In particular, note that we made it slightly harder to use the system database. The intent now is that the system database is reserved for managing the RavenDB server itself, and all users’ data will reside in their own databases.

You can also start a compaction directly from the studio:

image


Compactions are good if you want to ask RavenDB to return some disk space to the OS (by default we reserve it for our own usage).

Restore & backup are possible via the studio, but usually, admins want to script those out. We had Raven.Backup.exe to handle scripted backup for a while now. And you could restore using Raven.Server.exe --restore  from the command line.

The problem was that this restored the database to disk,  but didn’t wire it to the server, so you had the extra step of doing that. This was useful for restoring system databases, not so much for named databases.

We now have:

  • Raven.Server.exe  --restore-system-database --restore-source=C:\backups\system\2014-09-17 --restore-destination=C:\Raven\Data\System
  • Raven.Serve.exe --restore-database=http://localhost:8080 --restore-source=C:\backups\RealEstateRUs\2014-09-17 --restore-database-name=C:\Raven\Data\Databases\RealEstateRUs

Which make a clear distinction between those operations.

Another related issue is how Smuggler handles error. Previously, the full export process had to complete successfully for you to have a valid output. Now we are more robust for errors such as unreliable network or timeouts. That means that if your network has a tendency to cut connections off at the knee, you will be able to resume (assuming you use incremental export) and still get your data.

We have also made a lot of changes in the Smuggler to make it work more nicely in common deployment scenarios, where request size and time are usually limited. The whole process is more robust for errors now.

Speaking of making things more robust, another area where we put attention to was memory usage over time. Beyond just reducing our memory usage in common scenarios, we have also improved our GC story. We can now invoke explicit GCs when we know that we created a lot of garbage that needs to be rid off. We’ll also invoke Large Object Heap compaction if needed, utilizing the new features in the .NET framework.

That is quite enough for a single post, but still doesn’t cover all the operations change, I’ll cover the stuff that should make your drool on the next post.

time to read 3 min | 524 words

One of the most challenging things to do in production is to know what is going on? In order to facilitate that, we have dedicate some time to exposing the internal guts of RavenDB to the outside world (assuming that the outside world has the appropriate permissions).

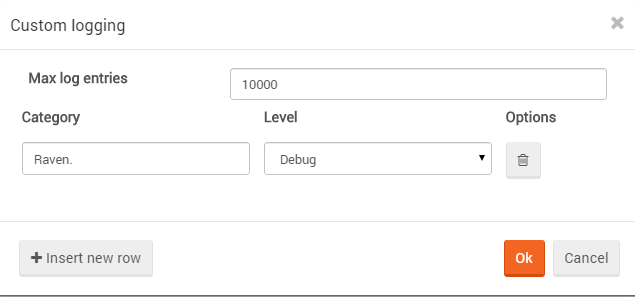
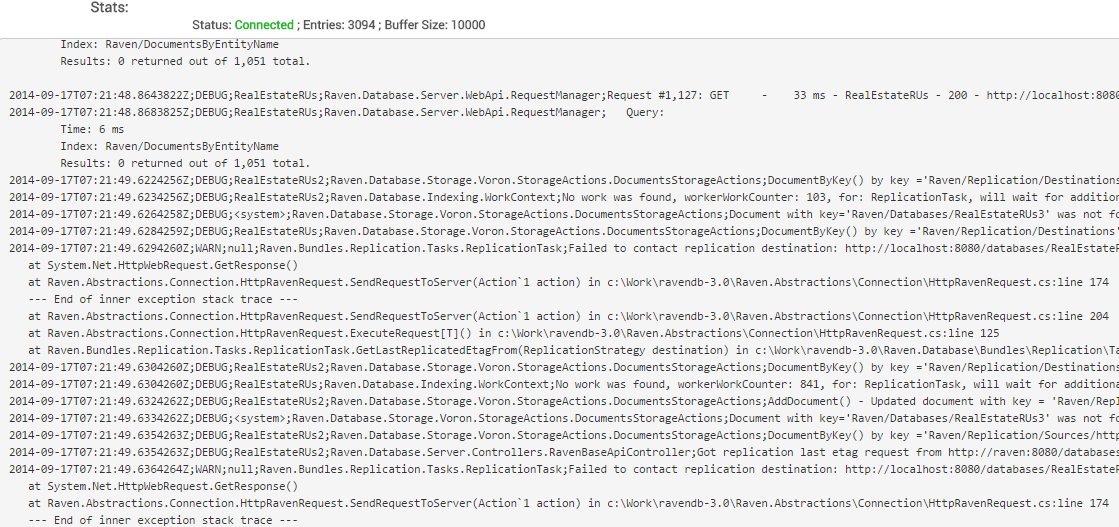
One way to look at that is to subscribe to the log stream from RavenDB, you can do it like this:

image

This gives you the following:

image

Note that this requires no configuration changes, or restarting the server or database. As long as your logs subscription is active, we’ll send you a live stream of all the log activity in RavenDB, which should allow you to get a lot of useful insights about what exactly it is that RavenDB is doing.

This is especially important if you need to do any sort of trouble shooting, because that is when you need to have logs, and restarting the server to enable them is often out of the question (it would likely resolve the issue you want to understand). And honestly, this is a feature that we need to support customers, it is going to be much easier to just say “let us look at the logs”, rather than having to go over how to configure them, etc. Another thing to note is the fact that this can all be done remotely, you don’t have to have access to the physical server. It does require you to have admin permissions on the server, so not any user can do that.

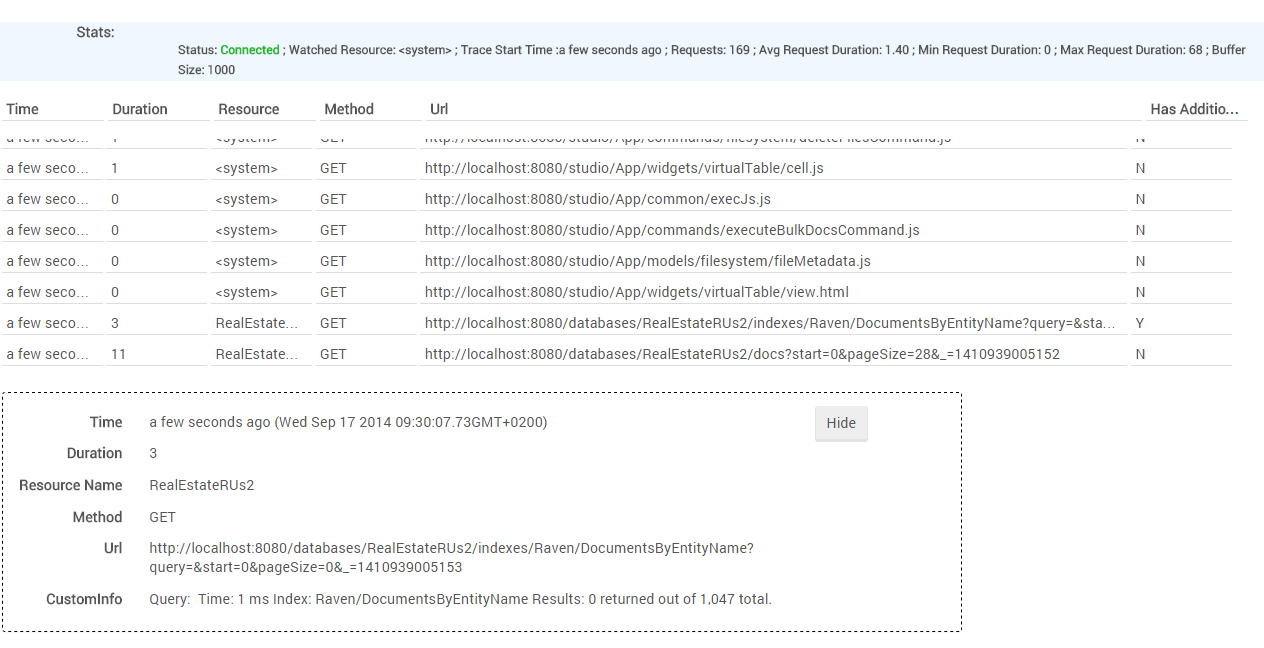
Another production view that is available to you is the Traffic Watcher:

image

This gives you the option of looking at the requests that are actually hitting the server. It is a subset of information from the logs, but it is usually a lot more interesting to watch. And again, this can be done remotely as well. You can watch all databases, or just a single one.

But most importantly from support perspective is the new Debug Info! package. And yes, it deserver the bang in the name. What this does is gather a lot of important information from the database, all the current stats, and a lot of stuff that we need to figure out what is going on. The idea is that if you have a problem, we won’t have to ask for a lot of separate pieces of information, you can get it all as a single shot.

Oh, and we can also grab the actual stack trace information from your system, so we even know exactly what your system is doing.

In my next post, I’ll discuss one last operational concern, optimizations.

time to read 5 min | 847 words

This has been the most important change in RavenDB 3.0, in my opinion. Not because of complexity and scope, pretty much everything here is much simpler than other features than we have done. But this is important because it makes RavenDB much easier to operate. Since the get go, we have tried to make sure that RavenDB would be a low friction system. We usually focused on the developer experience, and that showed when we had to deal with operational issues.

Things were more complex than they should. Now, to be fair, we had the appropriate facilities to figure things out, ranging from debug endpoints, to performance counters to a great debug log story. The problem is that in my eye, we were merely on par with other systems. RavenDB wasn’t created to be on par, RavenDB was created so when you use this, you would sigh and say “that is how it should be done”. With RavenDB 3.0, I think we are much closer to that.

Because we have done so much work here, I’m going to split things to multiple posts. This one is the one with all the pretty pictures, as you can imagine. Next one will talk about the actual operational behavior changes we made.

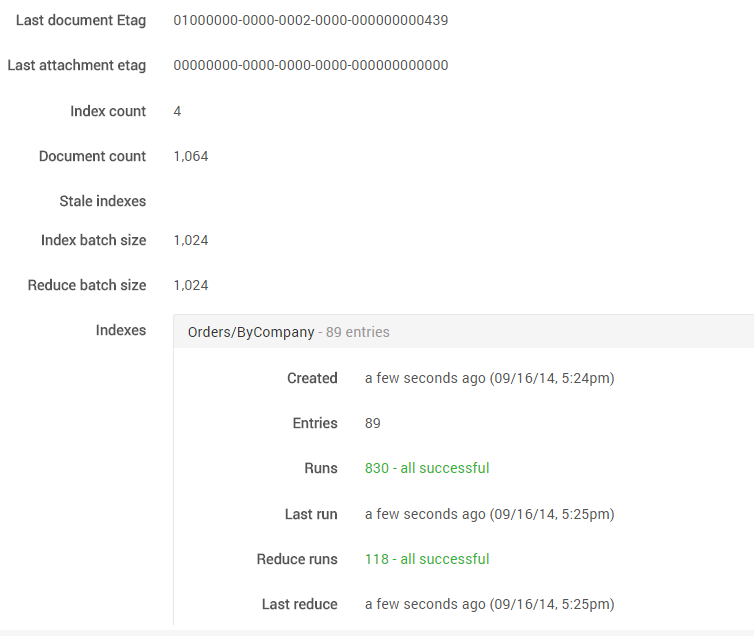
Let me go over some of those things with you. Here you can see the stats view, including looking at an index details.

image

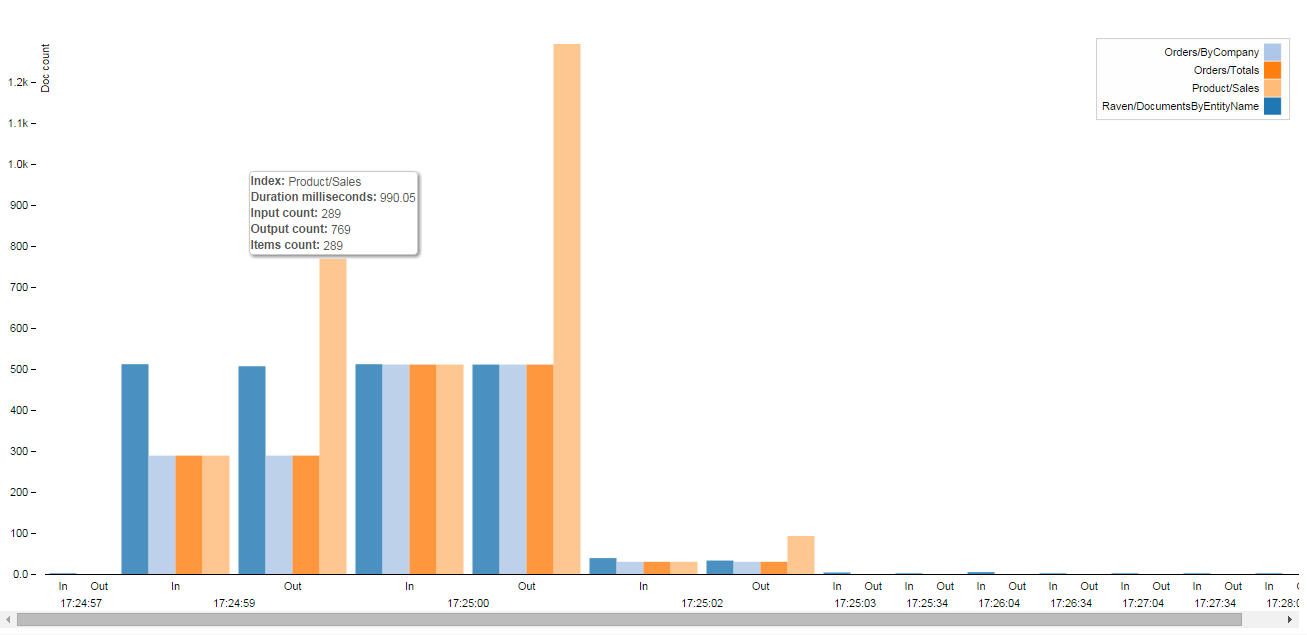
That is similar to what we had before. But it gets interesting when we want to start actually looking at the data more deeply. Here are the indexing stats on my machine:

image

You can see that the Product/Sales index has a big fanout, by the fact that it has more items out than in, for example. You can also see how much items we indexed per batch, and how we do parallel indexing.

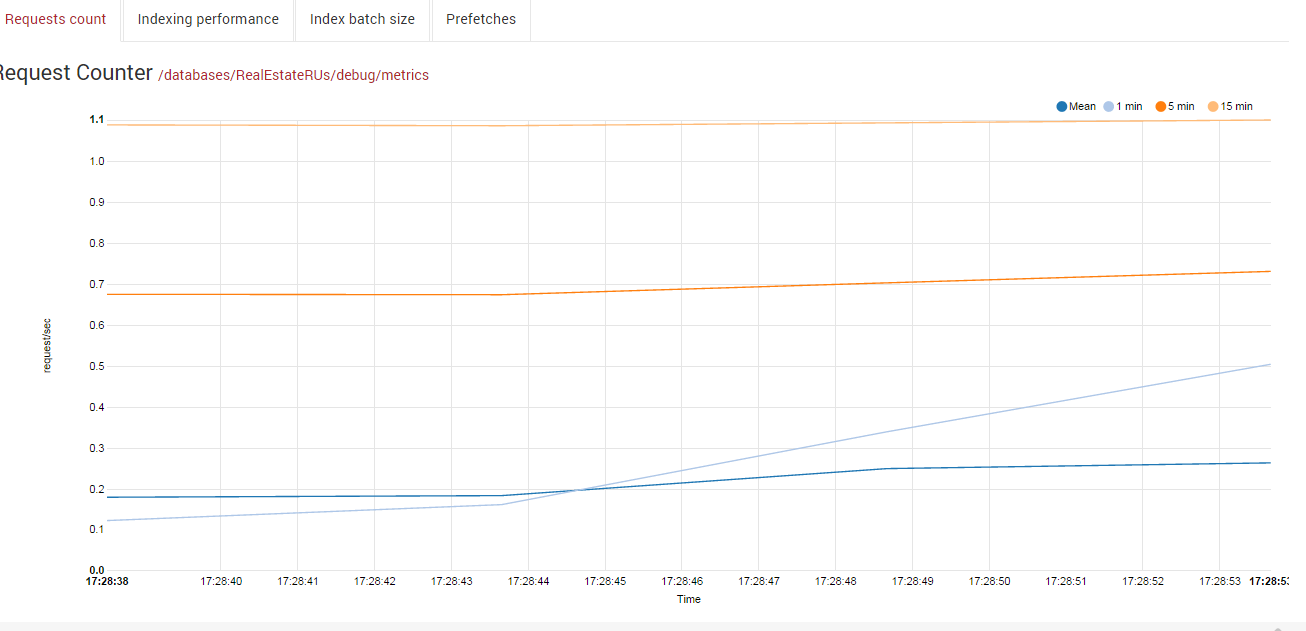
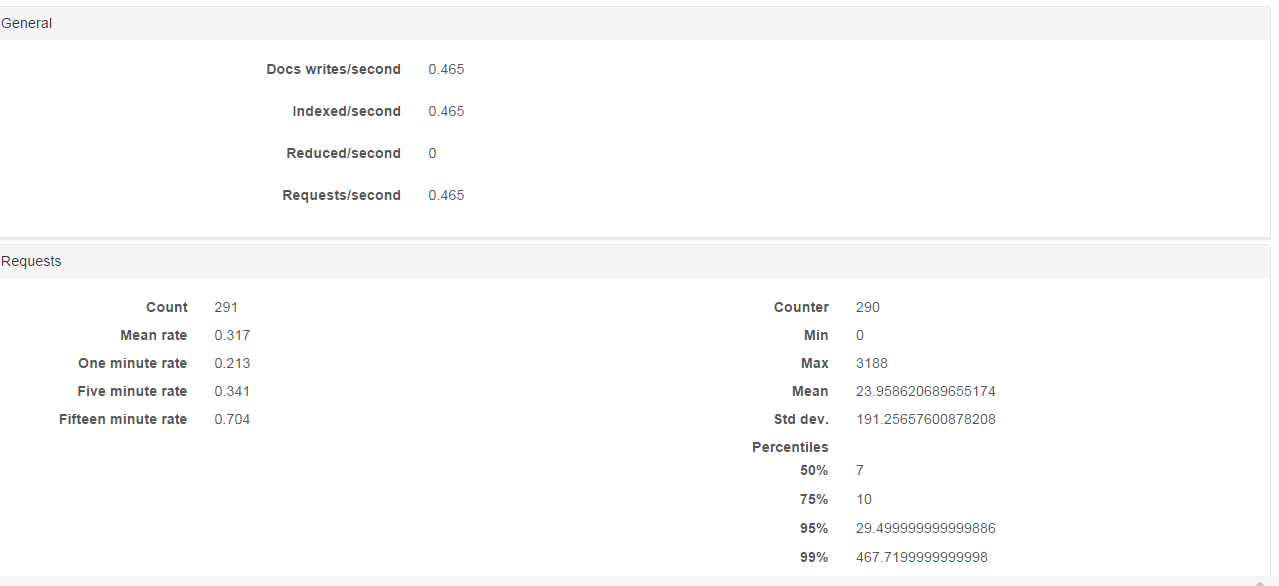
We also have a lot more metrics to look at. The current requests view along several time frames.

image

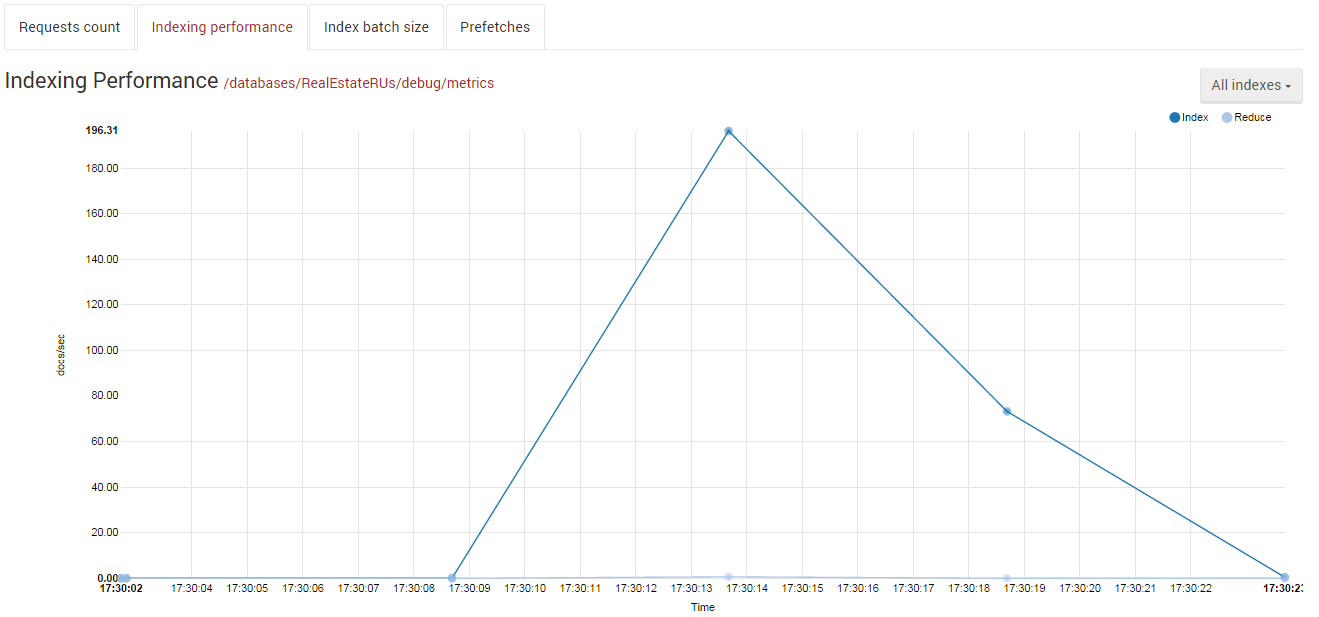
The live index work view:

image

The indexing batch size and the perfetching stats graph gives us live memory consumption usage for indexing, as well as some view on what indexing strategy is currently in use.

Combining those stats, we have a lot of information at our fingertips, and can get a better idea about what exactly is going on inside RavenDB.

But so far, this is just to look at things, let us see what else we can do. RavenDB does a lot of things in the background. From bulk insert work to set based operations. We added a view that let you see those tasks, and cancel them if you need to:

image


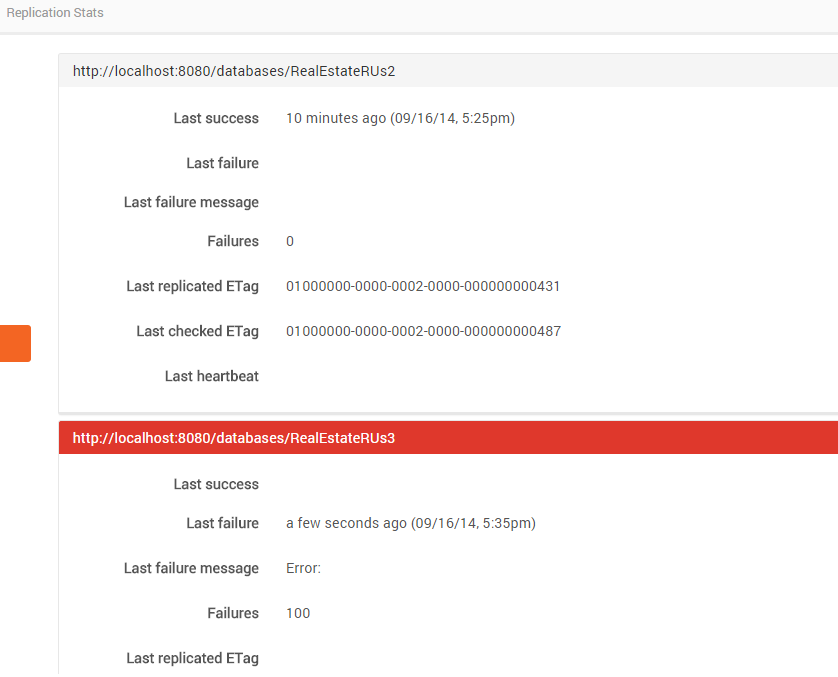
You can now see all the work done by the replication background processes, which will give you a better idea on what your cluster is doing. And of course there is the topology view that we already looked at.

image

We also added views for most of the debug endpoints that RavenDB has. Here we are looking at the subscribed changes connections.

image


We get a lot of metrics available for us now. In fact, we went a bit crazy there and started tracking a lot of stuff. This will help you understand what is going on internally. And you can also get nice histograms.

image

There is a lot of stuff there, so I won’t cover it all, but I would show you what I think is one of the nicest features:

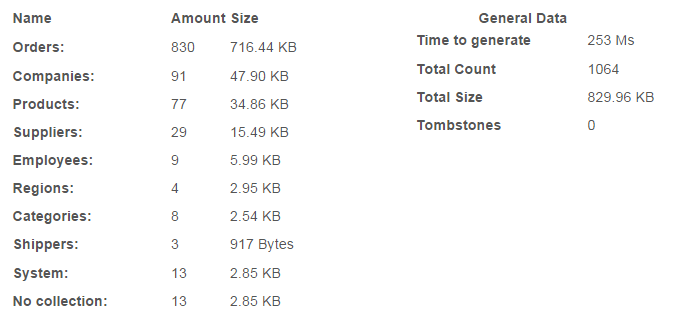
image

This will give you real stats about resource usage in your system. Including counts of documents per collection and the size on disk.

Okay, that is enough with the pretty pictures, on my next post, I’ll talk about the actual changes we made to support operations better.

time to read 3 min | 526 words

imageSQL Replication has been a part of RavenDB for quite some time,showing up for the first time in the 1.0 build as the Index Replication Bundle. This turned out to be a very useful feature, and in 3.0 we had a dedicated developer for this for several weeks, banging it into new and interesting shapes.

We started out with a proper design for how you want to use it. And I’m just going to take you through the process for a bit, then talk about the backend changes.

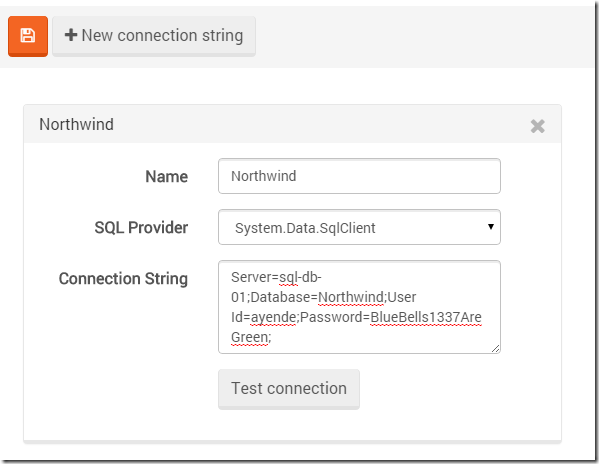
We start by defining a named connection string (note that you can actually test this immediately):

image

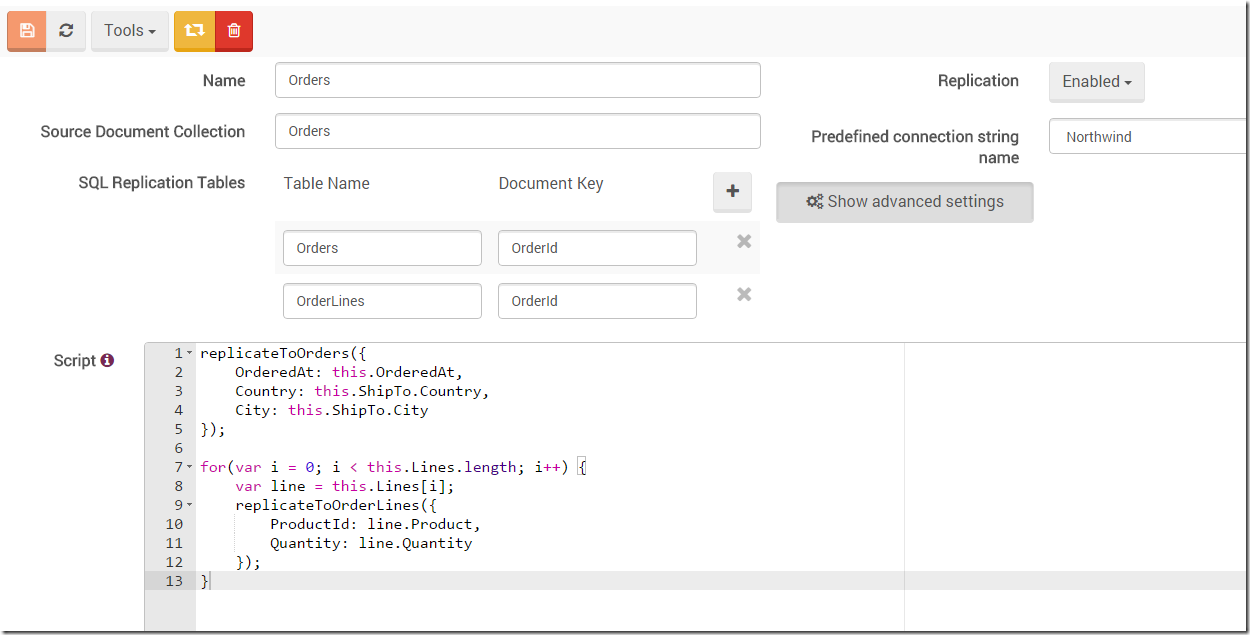
And then we define the actual replication behavior:

image

Note that we have the Tools control in the top? Clicking it and selecting Simulate will give you:

image

So you can actually see the commands that we are going to execute to replicate a specific document. That is going to save a lot of head scratching about “why isn’t this replicating properly”.

You can even run this simulation against your source db, to check for errors such as constraint violations, etc.

The SQL Replication bundle now support forcing query recompilation, which avoid bad query plans caching in SQL Server:

image

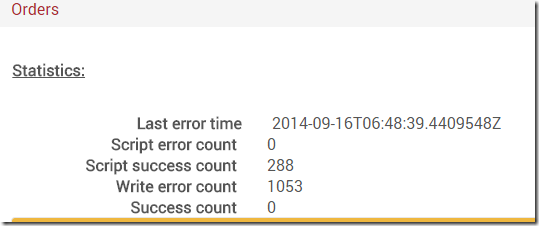
And for the prudent DBA, we have done a lot to give you additional information. In particular, you can look at the metrics and see what is going on.

image

And:

image

In this case, I actually don’t have a relational database on this machine to test this, but I’m sure that you can figure it out.

The nice thing about it, we’ll report separate metrics per table, so your DBA can see if a particular table is causing a slow down.

Overall, we streamlined everything and tried to give you as much information upfront as possible, as well as tracking the entire process. You’ll find it much easier to work with and troubleshoot if needed.

This actually ties very well with our next topic, the operations changes in RavenDB to make it easier to manager. But that will be in the a future post.

time to read 4 min | 611 words

RavenDB is an ACID database for documents, and it is a BASE database for queries. That design principle has serve us very well since the start, because it allow us to modify the way we are handling things internally without violating the promises we give to the user.  In particular, the ability to hand out potentially stale information has been crucial for a lot of performance optimizations in RavenDB.

That said, while is has been a core feature of RavenDB from the start, I haven’t found a single user who had a hankering for longer staleness latency. That is a long way to say that we managed to reduce further the number of times RavenDB will return query results marked as stale. We have talked about some of this in the previous posts, with regards to better batching and optimization in the indexing process itself, but we already talked about this.

In RavenDB 3.0, we are using smarter algorithm to detect if an index has potentially changed, in particular, we can detect if the index isn’t covering any of the changed documents that it hasn’t had a chance to index yet. If we know that no document yet to be indexed is going to be indexed by this index, we can short circuit indexing and declare the index as non stale. In practice, this should resolve a common misconception “I changed one document, all indexes became stale” by having a better match between what the user thinks is going on and the externally observed behavior.

Your applications would be a little faster, but that should be the sole difference from your point of view.

Another change that does require you to take active action is nested transformers. The idea is that transformers often encompass some piece of business logic related to how to pull an entity / entities for a particular task. It would be nice not to have to duplicate this logic (and maintain it over time). With RavenDB 3.0, you can now nest transformers and have one transformer call another to do some part of the work.

Here is how this looks:

//ProductsTransformer
TransformResults = products =>
from doc in products
select new
{
Name = doc.Name.Reverse()
};

// another transformer
TransformResults = products =>
from doc in products
select new
{
Product = doc,
Transformed = TransformWith("ProductTransformer", doc)
};

The 2nd transformer calls to the ProductsTransformer by name, allow it to run its own processing (and potentially call yet another transformer, etc). Note that a transformer cannot recurse either directly on indirectly. In other words ,you cannot call yourself, or another transformer that has called you.

There has been a lot of other changes, of course, but a lot of them are too small to merit such a mention. Better support for querying unsigned integers is hardly earth shattering. But there has been a lot of those kind of changes. It means that you’ll have a smoother experience overall.

Next post, replication Smile.

time to read 6 min | 1113 words

concept-18290_640We talked a lot about the changes we made for indexing, now let us talk about the kind of changes we are talking about from the query side of things. More precisely, this is when we start asking questions about our queries.

Timing queries. While it is rare that we have slow queries in RavenDB, it does happen, and when it does, we treat it very seriously. However, in the last few cases that we have seen, the actual problem wasn’t with RavenDB, it was with sending the data back to the client when we had a large result set and large number of documents.

In RavenDB 3.0, we have added the ability to get detailed statistics about what is the cost of the query in every stage of the pipeline.

RavenQueryStatistics stats;
var users = session.Query<Order>("Orders/Totals")
    .Statistics(out stats)
    .Customize(x => x.ShowTimings())
    .Where(x=>x.Company == "companies/11" || x.Employee == "employees/2")
    .ToList();

foreach (var kvp in stats.TimingsInMilliseconds)
{
    Console.WriteLine(kvp.Key + ": " + kvp.Value);
}

Console.WriteLine("Total: " + stats.DurationMilliseconds);

We can now ask RavenDB to explain us its reasoning when doing so:

  • Lucene search: 10
  • Loading documents: 2
  • Transforming results: 0
  • Total: 21

As you can see, the total time for this query is 21 ms, and we have 12 ms accounted for in the actual search time. The rest is network traffic.  This can help you diagnose more easily where the problem is, and hence, how to solve it.

Query timeout and cancellation. As I mentioned, we don’t really have long queries in RavenDB very often. But that is actually is something that happens, and we need a way to deal with that. RavenDB now places a timeout on the amount of time a query gets to run (including querying Lucene, loading documents or transforming the results). A query that doesn’t complete in time will be cancelled, and an error will be returned to the user.

You can also view the currently executing queries and kill a long running query (if you have specified a high timeout, for example).

Explaining queries. Sometimes it is easy to understand why RavenDB has decided to give you documents in a certain order. You asked them sorted by date, and you get them sorted by date. But when you are talking about complex queries, that is much harder. RavenDB will sort the results by default based on relevancy, and that can sometimes be a bit puzzling to understand.

Here is how we can do this:

session.Advanced.DocumentQuery<Order>("Orders/Totals")
                    .Statistics(out stats)
                    .WhereEquals("Company", "companies/11")
                    .WhereEquals("Employee", "employees/3")
                    .ExplainScores()
                    .ToList();

var explanation = stats.ScoreExplantaions["orders/759"];

The result of this would be something that looks like this:

0.6807194 = (MATCH) product of:
  1.361439 = (MATCH) sum of:
    1.361439 = (MATCH) weight(Employee:employees/3 in 469), product of:
      0.4744689 = queryWeight(Employee:employees/3), product of:
        2.869395 = idf(docFreq=127, maxDocs=830)
        0.165355 = queryNorm
      2.869395 = (MATCH) fieldWeight(Employee:employees/3 in 469), product of:
        1 = tf(termFreq(Employee:employees/3)=1)
        2.869395 = idf(docFreq=127, maxDocs=830)
        1 = fieldNorm(field=Employee, doc=469)
  0.5 = coord(1/2)

And if we were to ask for the explanation for orders/237, we will get:

6.047595 = (MATCH) sum of:
  4.686156 = (MATCH) weight(Company:companies/11 in 236), product of:
    0.8802723 = queryWeight(Company:companies/11), product of:
      5.32353 = idf(docFreq=10, maxDocs=830)
      0.165355 = queryNorm
    5.32353 = (MATCH) fieldWeight(Company:companies/11 in 236), product of:
      1 = tf(termFreq(Company:companies/11)=1)
      5.32353 = idf(docFreq=10, maxDocs=830)
      1 = fieldNorm(field=Company, doc=236)
  1.361439 = (MATCH) weight(Employee:employees/3 in 236), product of:
    0.4744689 = queryWeight(Employee:employees/3), product of:
      2.869395 = idf(docFreq=127, maxDocs=830)
      0.165355 = queryNorm
    2.869395 = (MATCH) fieldWeight(Employee:employees/3 in 236), product of:
      1 = tf(termFreq(Employee:employees/3)=1)
      2.869395 = idf(docFreq=127, maxDocs=830)
      1 = fieldNorm(field=Employee, doc=236)

In other words, we can see that orders/237 is ranked much higher than orders/759. That is because is matched both clauses of the query. And a match on Company is a much stronger indication for relevancy because Companies/11 appears only in 10 documents out out 830, while Employees/3 appears in 127 out of 830.

For details about this format, see this presentation, it actually talks about Solr here, but this data comes from Lucene, so it applies to both.

That is it about queries diagnostics, next, we’ll deal with transformers and another important optimization, the staleness reduction system.

time to read 7 min | 1394 words

chess-345904_640

We talked previously about the kind of improvements we have in RavenDB 3.0 for the indexing backend. In this post, I want to go over a few features that are much more visible.

Attachment indexing. This is a feature that I am not so hot about, mostly because we want to move all attachment usages to RavenFS. But in the meantime, you can reference the contents of an attachment during index. That can let you do things like store large text data in an attachment, but still make it available for the indexes. That said, there is no tracking of the attachment, so if it change, the document that referred to it won’t be re-indexed as well. But for the common case where both the attachments and the documents are always changed together, that can be a pretty nice thing to have.

Optimized new index creation. In RavenDB 2.5, creating a new index would force us to go over all of the documents in the database, not just the documents that we have in that collection. In many cases, that surprised users, because they expected there to be some sort of physical separation between the collections. In RavenDB 3.0, we changed things so creating a new index on a small collection (by default, less than 131,072 items) will be able to only touch the documents that belong to the collections being covered by that index. This alone represent a pretty significant change in the way we are processing indexes.

In practice, this means that creating a new index on a small index would complete much more rapidly. For example, I reset an index on a production instance, it covers about 7,583 documents our of 19,191. RavenDB was able to index that in just 690 ms, out of about 3 seconds overall that took for the index reset to take place.

What about the cases where we have new indexes on large collections? At this point, in 2.5, we would do round robin indexing between the new index and the existing ones. The problem was that 2.5 was biased toward the new index. That meant that it was busy indexing the new stuff, while the existing indexes (which you are actually using) took longer to run. Another problem was that in 2.5 creating a new index would effectively poison a lot of performance heuristics.  Those were built for the assumptions of all indexes running pretty much in tandem. And when we have one or more that weren’t doing so… well, that caused things to be more expensive.

In 3.0, we have changed how this works. We’ll have separate performance optimization pipelines for each group of indexes based on its rough indexing position. That lets us take advantage of batching many indexes together. We are also not going to try to interleave the indexes (running first the new index and then the existing ones). Instead, we’ll be running all of them in parallel, to reduce stalls and to increase the speed in which everything comes up to speed.

This is using our scheduling engine to ensure that we aren’t actually overloading the machine with computation work (concurrent indexing) or memory (number of items to index at once). I’ve very proud in what we have done here, and even though this is actually a backend feature, it is too important to get lost in the minutia of all the other backend indexing changes we talked about in my previous post.

Explicit Cartesian/fanout indexing. A Cartesian index (we usually call them fanout indexes) is an index that output multiple index entries per each document. Here is an example of such an index:

from postComment in docs.PostComments
from comment in postComment.Comments
where comment.IsSpam == false
select new {
    CreatedAt = comment.CreatedAt,
    CommentId = comment.Id,
    PostCommentsId = postComment.__document_id,
    PostId = postComment.Post.Id,
    PostPublishAt = postComment.Post.PublishAt
}

For a large post, with a lot of comments, we are going to get an entry per comment. That means that a single document can generate hundreds of index entries.  Now, in this case, that is actually what I want, so that is fine.

But there is a problem here. RavenDB has no way of knowing upfront how many index entries a document will generate, that means that it is very hard to allocate the appropriate amount of memory reserves for this, and it is possible to get into situations where we simply run out of memory. In RavenDB 3.0, we have added explicit instructions for this. An index has a budget, by default, each document is allowed to output up to 15 entries. If it tries to output more than 15 entries, that document indexing is aborted, and it won’t be indexed by this index.

You can override this option either globally, or on an index by index basis, to increase the number of index entries per document that are allowed for an index (and old indexes will have a limit of 16,384 items, to avoid breaking existing indexes).

The reason that this is done is so either you didn’t specify a value, in which case we are limited to the default 15 index entries per document, or you did specify what you believe is a maximum number of index entries outputted per document, in which case we can take advantage of that when doing capacity planning for memory during indexing.

Simpler auto indexes. This feature is closely related to the previous one. Let us say that we want to find all users that have an admin role and has an unexpired credit card. We do that using the following query:

var q = from u in session.Query<User>()
        where u.Roles.Any(x=>x.Name == "Admin") && u.CreditCards.Any(x=>x.Expired == false)
        select u;

In RavenDB 2.5, we would generate the following index to answer this query:

from doc in docs.Users
from docCreditCardsItem in ((IEnumerable<dynamic>)doc.CreditCards).DefaultIfEmpty()
from docRolesItem in ((IEnumerable<dynamic>)doc.Roles).DefaultIfEmpty()
select new {
    CreditCards_Expired = docCreditCardsItem.Expired,
    Roles_Name = docRolesItem.Name
}

And in RavenDB 3.0 we generate this:

from doc in docs.Users
select new {
    CreditCards_Expired = (
        from docCreditCardsItem in ((IEnumerable<dynamic>)doc.CreditCards).DefaultIfEmpty()
        select docCreditCardsItem.Expired).ToArray(),
    Roles_Name = (
        from docRolesItem in ((IEnumerable<dynamic>)doc.Roles).DefaultIfEmpty()
        select docRolesItem.Name).ToArray()
}

Note the difference between the two. The 2.5 would generate multiple index entries per document, while RavenDB 3.0 generate just one. What is worse is that 2.5 would generate a Cartesian product, so the number of index entries outputted in 2.5 would be the number of roles for a user times the number of credit cards they have.  In RavenDB 3.0, we have just one entry, and the overall cost is much reduced. It was a big change, but I think it was well worth it, considering the alternative.

In my next post, I’ll talk about the other side of indexing, queries. Hang on, we still have a lot to go through.

time to read 8 min | 1401 words

image

RavenDB indexes are one of the things that make is more than a simple key/value store. They are incredibly important for us. And like many other pieces in 3.0, they have had a lot of work done, and now they are sparkling & shiny. In this post I’m going to talk about a lot of the backend changes that were made to indexing, making them faster, more reliable and better all around. In the next post, I’ll discuss the actual user visible features we added.

Indexing to memory. Time and time again we have seen that actually hitting the disk is a good way of saying “Sayonara, perf”. In 2.5, we introduced the notion of building new indexes in RAM only, to speed up the I/O for new index creation. With 3.0, we have taken this further and indexes no longer go to disk as often. Instead, we index to an in memory buffer, and only write to disk once we hit a size/time/work limit.

At that point, we’ll flush those indexes to disk, and continue to buffer in memory. The idea is to reduce the amount of disk I/O that we do, as well as batch it to reduce the amount of time we spend hitting the disk.  Under high load, this can dramatically improve performance, because we are I/O bound so much. In fact, for the common load spike scenario, we never have to hit the disk for indexing at all.

Aysnc index deletion. Indexes in RavenDB are composed of the actual indexed data, as well as the relevant metadata about the index. Usually, metadata is much smaller than the actual data. But in this case, an index metadata in the case of a map/reduce index include all of the intermediary steps in the process, so we can do incremental map/reduce. If you use LoadDocument, we need to maintain the documents references, and on large databases, that can take a lot of space. As a result of that, index deletion could take a long time in RavenDB 2.5.

With RavenDB 3.0, we are now doing async index deletions, so you can delete the index, which does a very short operation to free up the index name, but do the actual work to cleanup after the index in the background. And yes, you can restart the database midway through, and it will resume the async index deletion behavior. The immediate behavior is that it is much easier to manage indexes, because you delete a big index and not have to wait for this to continue. This most commonly showed up when updating an index definition.

Index ids instead of names. Because we had to break the 1:1 association between index and its name, we moved to an internal representation of indexes using numeric ids. That was pretty much forced on us because we had to distinguish between the old index Users/Search (who is now in the process of being deleted) and the new Users/Search index (who is now in the process of being indexed).

A happy side effect of that was that we actually has a more efficient internal structure for working with indexes in general. That speeds up writes and reads and reduce the overall disk space that is used.

Interleaves indexing & task executions. RavenDB uses the term task to refer to cleanup jobs (mostly) that run on the indexes. For example, removing deleted index entries, or re-indexing referencing documents when the referenced document has changed. In 2.5, it was possible to get a lot of tasks in the queue, which would stall indexing. For example, mass deletes were one common scenario were the task queue would be full and take a bit to drain. In RavenDB 3.0 we have changed things so a big task queue won’t impact indexing to that extent. Instead, we can interleave indexing and task execution so we won’t stall the indexing process.

Large documents indexing. RavenDB doesn’t place arbitrary limits on the size of documents. That is great as a user, but it places a whole set of challenges for RavenDB when we need to index. Assume that we want to introduce a new index of a relatively large collection of documents. We will start indexing the collection, realize that there is a lot to index, so we’ll grow the number of items to be indexed in each batch. The problem is that is is pretty common that as the system grows, so does the documents. So a lot of the documents that were updated later on would be bigger than those we had initially. That can get to a point where we are trying to fetch a batch size of 128K documents, but each of them is 250Kb in size. That requires us to load 31 GB of documents to index in a single batch.

That might take a while, even if we are talking just about reading them from disk, leaving aside the cost in memory. This was worse because in many cases, when having so much data, the users would usually go for the compression bundle. So when RavenDB tried to figure out what is the size of the documents (by checking its on disk size), it would get the compressed size. Hilarity did not ensue as a result, I tell you that. In 3.0, we are better prepared to handle such scenarios, and we know to count the size of the document in memory, as well as being more proactive about limiting the amount of memory we’ll use per batch.

I/O bounded batching. A core scenario for RavenDB is running on the cloud platforms. We have customers running us on anything from i2.8xlarge EC2 instances (32 cores, 244GB RAM, 8 x 800 GB SSD drives) to A0 Azure instances (shared CPU, 768 MB RAM, let us not talk about the disks, lest I cry). We actually got customers complaints about “Why isn’t RavenDB using all of the resources available to it”, because we could handle the load in about 1/4 of the resources that the machine in question had available. Their capacity calculations were based on another database product, and RavenDB works very differently, so while they had no performance complaints, there were kinda upset that we weren’t using more CPU/RAM – they paid for those, so we should use them.

Funny as that might seem, the other side is not much better. The low end cloud machines are slow, and starved of just about any resource that you can name. In particular, I/O rates for the low end cloud machines are pretty much abysmal. If you created a new index on an existing database in one of those machine, it would turn out that a lot of what you did was just wait for I/O. The problem would actually grow worse over time. We were loading a small batch (took half a second to load from disk) and indexing it. Then we loaded another batch, and another, etc. As we realized that we have a lot to go through, we increased the batch size. But the time we would spend waiting for disk would grow higher and higher.  From the admin perspective, it would appears as if we were hanging, and not actually doing any indexing.

In RavenDB 3.0, we are not bounding the I/O costs, so we’ll try to load a batch for a while, but if we can’t get enough in a reasonable time frame, we’ll just give you what we already have so far, let you index that, and continue the I/O operation in a background thread. The idea is that by the time you are done indexing, you’ve another batch of documents available for you. Combined with the batch index writes, that gave us a hell of a perceived performance boost (oh, it is indexing all the time, and I can see that it is doing a lot of I/O and CPU, so everything is good) and real actual gains (we were able to better parallelize the load process this way).


Summary – pretty much all of those changes are not something that you’ll really see. There are all engine changes that happen behind the scene. But all of them are going to work together to end up giving you a smoother, faster and overall better experience.

FUTURE POSTS

  1. Partial writes, IO_Uring and safety - about one day from now
  2. Configuration values & Escape hatches - 4 days from now
  3. What happens when a sparse file allocation fails? - 6 days from now
  4. NTFS has an emergency stash of disk space - 8 days from now
  5. Challenge: Giving file system developer ulcer - 11 days from now

And 4 more posts are pending...

There are posts all the way to Feb 17, 2025

RECENT SERIES

  1. Challenge (77):
    20 Jan 2025 - What does this code do?
  2. Answer (13):
    22 Jan 2025 - What does this code do?
  3. Production post-mortem (2):
    17 Jan 2025 - Inspecting ourselves to death
  4. Performance discovery (2):
    10 Jan 2025 - IOPS vs. IOPS
View all series

Syndication

Main feed Feed Stats
Comments feed   Comments Feed Stats
}