How to find a memory leak
Originally posted at 10/17/2010
I got the following message in the rhino tools mailing list:
I am looking into Rhino-esb and NServiceBus for a smart client application. I was doing some stress testing lately and I noticed some very strange behavior with rhino-esb. I tried to send large numbers of requests at the same time (6000-10000) and the memory of my back-end when using rhino-esb was continuously rising.
Since RSB is in production for the last two or three years, that seemed suspicious. Luckily, there was a reproduction that I could run. I tried it out, and indeed, memory seems to be taken, in proportion to the number of messages sent. That had me worried, really worried.
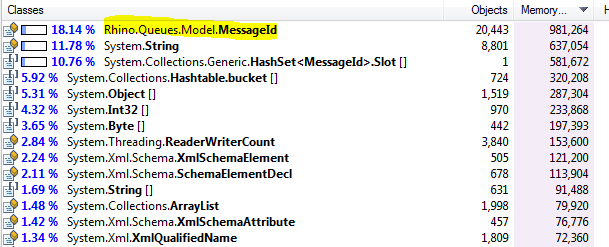
I run the application under memory profiling (using JetBrains dotTrace), and tried it. Which gave me this:
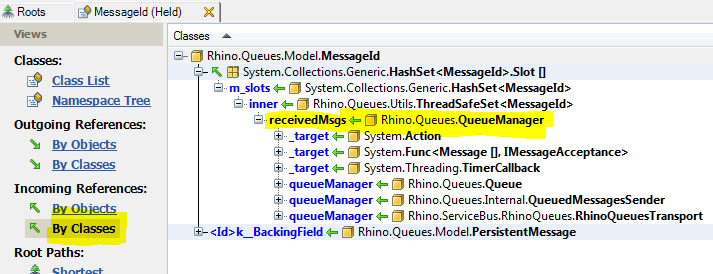
I went Ouch! and Huh?! at the same time. The next step was to find who was holding those. Luckily, that was as easy as asking the profiler.
And a short hop to the code explained what was actually going on.
There is a LRU buffer there to prevent duplicate messages from being sent, and the default limit for the buffer is 10,000. And since the buffer is swept once every 3 minutes. It would look like a memory leak.
But what really pleased me wasn’t so much the answer, but how easy it was to figure it out.


Comments
dottrace has saved my a**e on a Winforms project. It is so ridiculously easy to have leaks (memory, GDi objects, what-have-you) in a Winforms app, it is amazing...
As always only a bug reproduction can save hours of debugging:)
Love dottrace tips like this. Any good links again?
Memory leak are one of the hardest stuff to fight. But compared to C++ it is much more difficult to have a leak in c#, and with the exceptional profilers around there (dottrace, ANT) usually you can spot the problem with not great pain.
I remember the old days when you should use debug library for memory allocation so you can understand if some buffer was overwritten etc etc, and it seems to me amazing having tools that with some clicks tell you what is in memory, and where are all reference :).
The complete story and how we work-around it can be found here:
www.nikosbaxevanis.com/.../...hino-servicebus.html
The source-code for the sample is here: github.com/.../...its.CodeSamples.Rhino.ServiceBus
Comment preview