Profiler new features, Sept Edition
The following features apply to NHProf, EFProf, HProf, L2SProf.
The first feature is something that was frequently requested, but we kept deferring. Not because it was hard, but because it was tedious and we had cooler features to implement: Sorting.
Yep. Plain old sorting for all the grids in the application.
Not an exciting feature, I’ll admit, but an important one.
The feature that gets me exciting is the Go To Session. Let us take the Expensive Queries report as a great example for this feature:
As you can see, we have a very expensive query. Let us ignore the reason it is expensive, and assume that we aren’t sure about that.
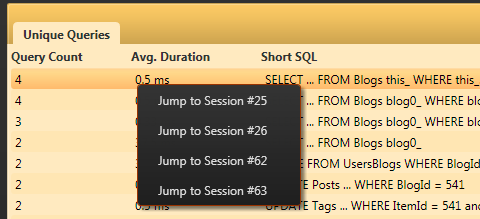
The problem with the reports feature in the profiler is that while it exposes a lot of information (expensive queries, most common queries, etc), it also lose the context of where this query is running. That is why you can, in any of the reports, right click on a statement and go directly to the session where it originated from:
We bring the context back to the intelligence that we provide.
What happen if we have a statement that appear in several sessions?
You can select each session that this statement appears in, getting back the context of the statement and finding out a lot more about it.
I am very happy about this feature, because I think that it closes a circle with regards to the reports. The reports allows you to pull out a lot of data across you entire application, and the Go To Session feature allows you to connect the interesting pieces of the data back to originating session, giving you where and why this statement was issued.


Comments
Excelent improvements, they will improve our workflow.
Is there any chance of you implementing a feature that calculates the total duration of selected statements?
+1 for calculation of total duration for selected statements - that would be a great feature.
Wow, bleeding edge. Grid sorting in 2010.
Sorry, nitpicker mode on tonight.
I don't understand why theres an X on the sorting?
Just a new feature suggestion. What about a FireBug add-on as the UI for NH-Prof ? Would be great to get the NH-Prof quality of NH reports on per request basis in the browser window, inside the tool everybody is using for web-development.
jmajaranta,
That is not likely to be possible.
Rafal,
As I mentioned explicitly in the post, it isn't bleeding edge. It is just something that we have never done, which we finally got around to doing.
NC,
The X is there to allow you to cancel the sorting. By default things are sorted by chronological order, and you might want to revert to that on occasion.
Oh ok, I'm used to functionality being
No Click = what ever default sorting is
First Click = Sort Column Ascending
Second Click = Sort Column Descending
Third Click = what ever default sorting is
Never seen a sort column with an X in it before.
NC,
I never heard about the 3rd click as an option.
Comment preview