Debugging Win32 crash in NH Prof
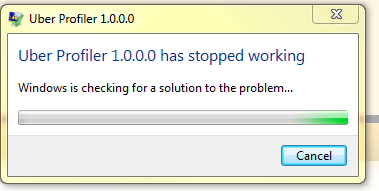
One of the things that happened when I pushed the UberProf build of NH Prof out is that people started complaining that trying to load a saved snapshot would crash the application. It took me a while to reproduce that, but I finally manage to get this:
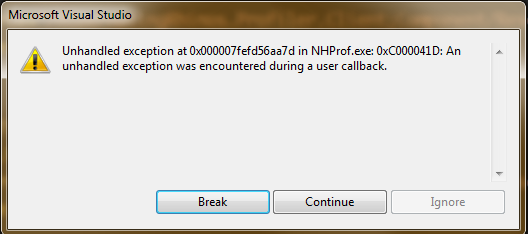
When I tried to debug it, all I got was this, and native stack trace that I had no way of actually resolving.
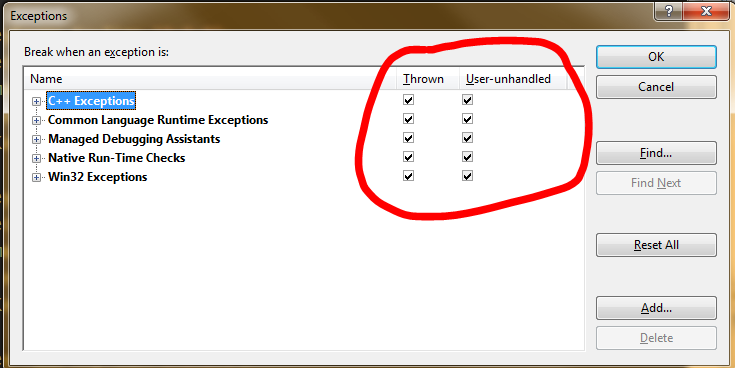
Trying to reproduce the problem in the debugger resulted in the same experience. I tried playing around with WinDbg for a while, but I am not very good at that, so I gave up and tried something that I find useful in the past. Tell Visual Studio that I want it to capture all types of exceptions, not just CLR exceptions:
Using this mode, I managed to get:
This led me to inspect the CancellableWaitBoxView.xaml, which contains:
And now it all made sense. With the UberProf builds, each profiler has a distinct assembly name. The problem is that this XAML refer to the master assembly name (which I use for development).
The reason this issue was hard to fix was that it is WPF window failing, and then somehow that exception is being swallowed and translated into a native error dialog, I am not quite sure why. Once I knew what the problem was, the fix was quite simple (using assembly resolve).


Comments
This is strange, I've got an error dialog with the "BindingFailure" text in it whenever I run the latest build (544 I think). I have no clue why you only get native stack.
I would have suggested to enable fusion logging to capture the possible binding failures.
http://msdn.microsoft.com/en-us/library/e74a18c4(VS.71).aspx
He did not know that fusion was involved.
Comment preview