How NH Prof integrate with a profiled application
In order to integrate with an application, NH Prof requires that you’ll reference the appender dll and call NHibernateProfiler.Initialize(). For Linq To SQL, the process is similar, but you call LinqToSqlProfiler.Initialize().
This post describe the internal implementation of how the appender works. Well, that is a lie, I am actually using this post as a design document for the restructuring process that I am currently at to support multiple OR/M backends. The idea is to give some background information so people who want to integrate with the profiler can do so.
There are two sides for integrating an OR/M with NH Prof (by the way, I am taking suggestions about how to call the uber product, so far xProf is the winning candidate, and I am not sure that I like it). The first part is actually integrating with the application, this is the job of the appender. It is responsible for capturing and sending the event stream from the profiled application to NH Prof. It is working under some fairly tight constraints:
- Performance is a huge consideration, the overhead of the profiler on the profiled application side must be kept to a minimum.
- The profiler may be started & stopped at any time, requiring application level support for reliable communication.
- In the future, I want to be able to support production profiling, which is a whole can of worms in itself.
The second part of profiler integration is actually doing a lot of work on the profiler side. It means getting the event stream, parsing it, analyzing it, etc. This is actually fairly narrow part of the
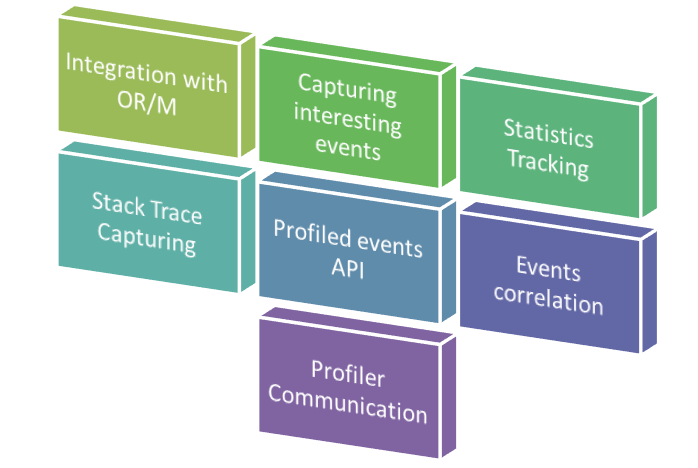
Overall, the structure looks something like this:
At the top layer of the stack, we have integration with the actual OR/M. This is the point where the OR/M gets to output different
The output that we need is things like:
- Session / Unit of Work Start & End notifications
- Executed SQL (including parameters)
- This should include capturing SQL executed as a result of lazy load operation.
- Last query duration
- Last query row count
- Entity loaded (name + key)
- Cached queries (for that matter, different types of queries, such as NHibernate Search’ queries)
- Warning / Error messages about the OR/M usage
- Statistics about the OR/M usage
The way NH Prof is dealing with this is quite simple, we have the following class:
public static class ProfilerIntegration
{
    public static void PublishProfilerEvent(
        Guid sessionId,
        string loggerName,
        string message
    );

    public static void PublishProfilerWarning(
        Guid sessionId,
        string message
    );

    public static void RegisterStatisticsSource(
      IStatisticsSource statsSource
    );
}
As you can see, the intent is to create an extremely simple integration point. The idea is that I don’t want to spend a lot of time integrating different OR/Ms. The only thing that I need to do if figure out how to get the OR/M to call those methods with the right information.
The format is textual and human readable. On the GUI side, NH Prof will take the information and start doing correlation and analysis. Part of the reason that I need to support different OR/Ms on the profiler side is that each of them has different ways of expressing those events, and I don’t want to try to do a single iota of extra work on the profiled application side if that can possibly be avoided.
Here is an example of how a minimal Linq To SQL implementation is using this infrastructure:
// this gets hooked into the l2s data context by black magic
public class LinqToSqlAppender : IDisposable
{
    public Guid id = Guid.NewGuid();

    public LinqToSqlAppender()
    {
        ProfilerIntegration.PublishProfilerEvent(id, "LinqToSql.DataContext", "data context opened");
    }

    public void OnSqlExecuted(string sql)
    {
        ProfilerIntegration.PublisProfilerEvent(id, "LinqtoSql.SQL", sql);
    }

    public void Dispose()
    {
        ProfilerIntegration.PublishProfilerEvent(id, "LinqToSql.DataContext", "data context closed");
    }
}
With this in place, I have a very short turn around time in the actual profiler implementation.


Comments
I've been meaning to ask you what you use for charts and drawings like this?
Thanks for the blog post Ayende and cheers for the prompt reply to my email the other day.
@Chris - It's just Office 2007 Smart Art I believe. Have a look in Powerpoint.
The profiler works in area of OR/M, so why not call it simply OrmProfiler.
Comment preview