How I found a memory leak
I got a report on a memory leak in using Rhino Queues, after a bit of a back and forth just to ensure that it isn’t the user’s fault, I looked into it. Sadly, I was able to reproduce the error on my machine (I say sadly, because it proved the problem was with my code). This post show the analysis phase of tracking down this leak.
That meant that all I had to do is find it. The problem with memory leaks is that they are so insanely hard to track down, since by the time you see their results, the actual cause for that is long gone.
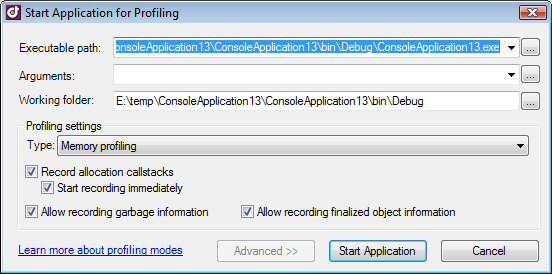
By I fired my trusty dotTrace and let the application run for a while with the following settings:
Then I dumped the results and looked at anything suspicious:
And look what I found, obviously I am holding buffers for too long. Maybe I am pinning them by making async network calls?
Let us dig a bit deeper and look only at arrays of bytes:
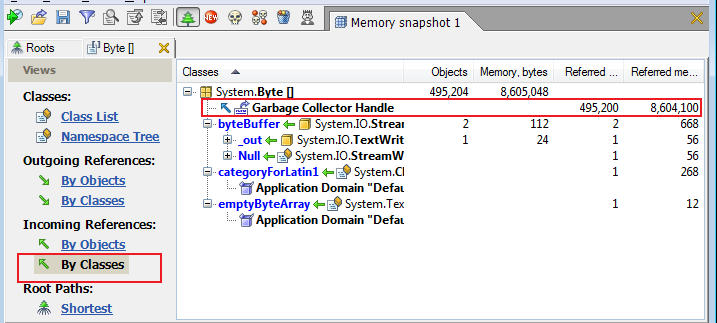
I then asked dotTrace to look at who is holding those buffers.
And that is interesting, all those buffers are actually held by garbage collector handle. By I have no idea what that is. Googling is always a good idea when you are lost, and it brought me to the GCHandle structure. But who is calling this? I certainly am not doing that. GCHandle stuff is only useful when you want to talk to unmanaged code. My suspicions that this is something related to the network stack seems to be confirmed.
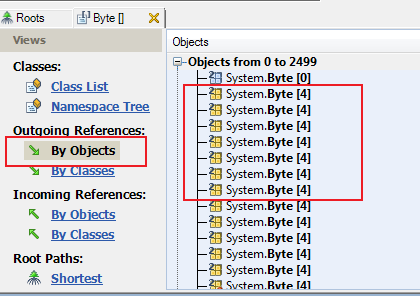
Let us take a look at the actual objects, and here I got a true surprise.
4 bytes?! That isn’t something that I would usually pass to a network stream. My theory about bad networking code seems to be fragile all of a sudden.
Okay, what else can we dig out of here? Someone is creating a lot of 4 bytes buffers. But that is all I know so far. DotTrace has a great feature for tracking such things, trackign the actual allocation stack, so I moved back to the roots window and looked at that.
What do you know, it looks like we have a smoking gun here. But it isn’t where I expected it to be. At this point, I left dotTrace (I didn’t have the appropriate PDB for the version I was using for it to dig into it) and went to reflector.
RertieveColumnAsString and RertieveColumnAsUInt32 are the first things that make me think of buffer allocation, so I checked them first.
Still following the bread crumbs trail, I found:
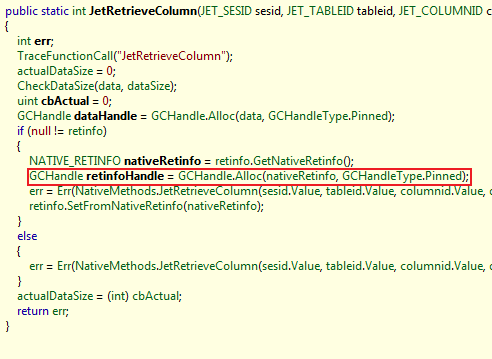
Which leads to:
And here we have a call to GCHandle.Alloc() without a corresponding Free().
We have found the leak.
Once I did that, of course, I headed to the Esent project to find that the problem has long been solved and that the solution is simply to update my version of Esent Interop.
It makes for a good story, at the very least :-)


Comments
Cool
GCHandles are bit horrible. I always wrap them in a SafeGCHandle to prevent leaking them like that.
"I say sadly, because it proved the problem was with my code."
I know what you mean, but to be honest, I actually prefer these days to find bugs that are my fault, because then I have control about fixing them.
@jdn, yep.. cmon ayende you know it could have been worse ayende.com/.../...ndling-from-the-middle-ages.aspx
;)
Awesome post. I love nice simple how to's on what can be complex things.
Comment preview