NH Prof feature: The 2nd level cache
One word of warning first, this feature is currently for entities only, NH Prof cannot (currently) inspect cached queries. That said, I am working on it, but this is something that is going to require some changes to NHibernate, so it is a feature that will be available on NHibernate 2.1 only.
That said, you can see the profiling result of this piece of code:
public class LoadEntityByIdFromSecondLevelCache : IScenario
{
	public void Execute(ISessionFactory factory)
	{
		int id;
		using (ISession s = factory.OpenSession())
		using(ITransaction tx = s.BeginTransaction())
		{
			id = s.CreateCriteria(typeof(Blog))
				.SetMaxResults(1)
				.UniqueResult<Blog>().Id;

			tx.Commit();
		}

		using (ISession s = factory.OpenSession())
		{
			var blog = s.Load<Blog>(id);
			Console.WriteLine(blog.Title);
		}
	}
}
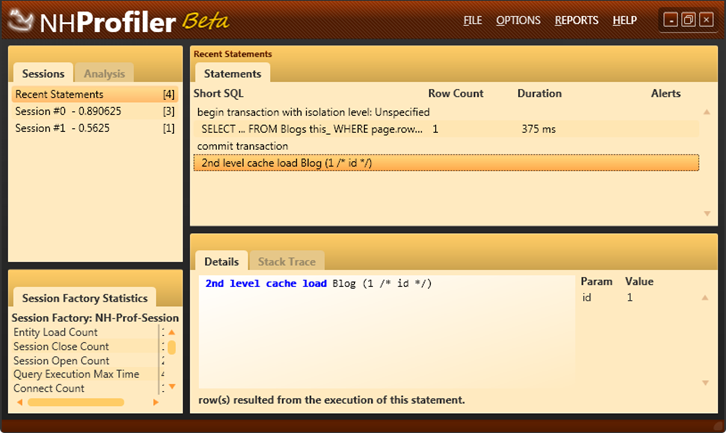
And, the actual profiler output:
We can clearly see that we loaded this entity from the second level cache, and that we didn't hit the database.
This is awesome, even if I say so myself.
Update: Here is the test for this feature:
[TestFixture]
public class CanDetect2ndLevelCaching : IntegrationTestBase
{
	[Test]
	public void Will_detect_entity_load()
	{
		ExecuteScenarioInDifferentAppDomain<LoadEntityByIdFromSecondLevelCache>();

		var first = observer.Model.Sessions[2]
			.Statements.OfType<StatementModel>().First();

		Assert.AreEqual("2nd level cache load Blog (1 /* id */)", first.Text);
	}
}
You might notice that this looks like it is traversing the UI. You are almost correct, it is traversing the View Model, which is an extremely rich model that allow us to do things like on the fly updates to all parts of the UI, Linq reporting and other nice stuff.
Among the most important benefits that it has is the fact that this is an end to end test of the system. From another app domain executing NHibernate code to the view model being updated by the profiler.


Comments
Yes, it's comforting to see how the cache is working for you.
I may have to shell out for this thing...
I have read the user guide og NH Prof and see the samples are for NH. If I use AR, how do I get the "session" object ? More exactly, how would you translate the following using AR?
// SELECT * FROM Posts
foreach (Post post in session.CreateQuery("from Post").List())
{
}
Thanks.
ionel,
Please check the documentation for AR, it is all there.
The documentation for NH attempts to use plain NHibernate API to maximize relevance .
Comment preview