Where are your debug hooks?
One of the most important things that I learned about working with software is that you have to design, from the get go, the debug ability of the system. This is important, because by default, here is how the your system reports its state:

To make things worse, in many cases, we are talking about things that are really hard to figure out. With Rhino Service Bus, I had started, from day one, to add a lot of debug logs, we had the idea of the logging endpoint, error messages went to the error queue along with the error that they generated, etc.
With NHibernate, it took me three days after starting to build NH Prof to figure out that NH Prof was a great tool to use when working on NHibernate itself. With NH Prof, the actual file format that we used is an event stream, which is logged locally. Which means that the process of opening a saved file and listening to a running application is the same. That means that you can send me you File > Save output, and I can simulate locally the exact conditions that led to whatever problems you had.
As software becomes more and more complex, threading is involved, complex scenarios are introduced, multiple actors involved and more and more data is streaming in. The old patterns of debugging through a problem become less and less relevant. To put it simply, it is less and less possible to easily reconstruct a problem in most scenarios, at least, it is very hard to do from the information given.
Last week I started to add support for profiling RavenDB. The intent was mostly to allow us to build better integration with web applications, but during the process of investigating a very nasty bug, I figured out that I could use this profiling information to figure out what is going on. I did, and seeing the information, it was immediately obvious what was wrong.
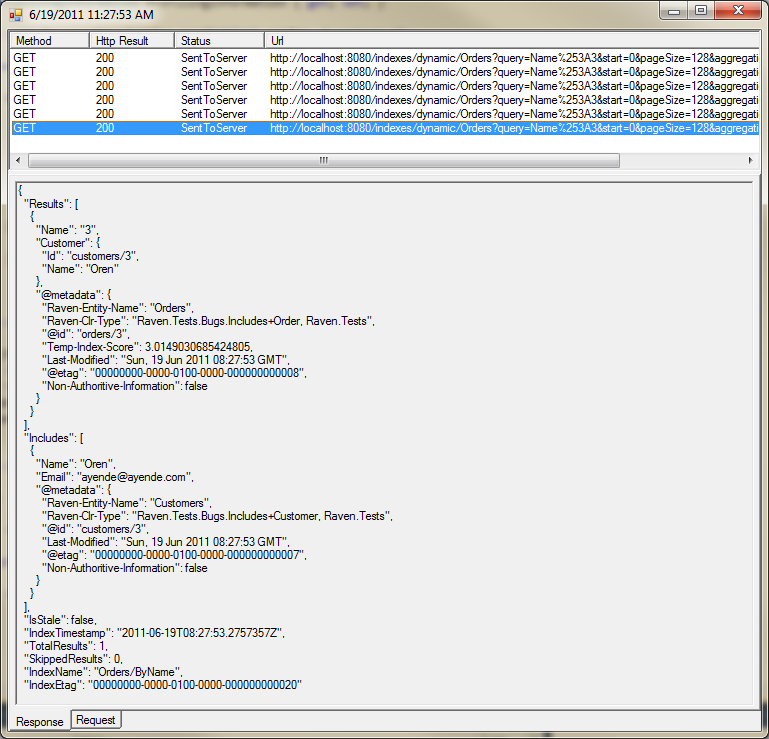
I decided that I might was well go the whole hog there and introduced this:
No, it isn’t RavenDB Profiler (not yet), but it is a debug visualizer that you can use to look at the raw requests. It is a bit more than just a Fiddler clone, too, since it has awareness of things like RavenDB sessions, caching, aggressive caching, etc.
In the short time that this API is available, it has already help resolve at least two separate (and very hard to figure out) bugs.
I learned two things from the experience:
- Having the debug hooks is critically important, because it means that you can access that information at need.
- Just having the debug hooks is not enough, you have to provide a good way for them to be used.
In this case, it is a debugger visualizer, but we will have additional ways to expose this information to the users.


Comments
By looking at debug output you also sometimes find problems that you did not know about yet. Very handy. It is like looking at the HTTP server logs from time to time to see what unexpected URLs are being requested.
Yes you are right, a good logging and debugging hooks are the key to solve problems especially in large system. I had an experience some days ago of troubleshooting a problem in a software composed by various distributed services based on msmq. The problem is when I read a code of type XYZ from a barcode reader in point A I do not see a record of type B in datawarehouse.
We were able to understand what happened thanks to a sql server profiler, but we had hard time to find the bug, because the software does not have debug hook to make us understand where the data got lost.
Great post.
Is it just me or the profiler would be easier to read and have a greater useful area if it was done using a simple Windows interface like the image above instead of WPF?
Dmitry, Are you talking about NH Prof? I think that the WPF version is better
Yes, I am talking about the NH/EF Prof.
It is obviously a matter of taste. The WPF interface is flashier. But it always looks to me with these types of tools that you can fit more information while keeping it readable using the standard Windows interface and a font similar to what you have in the screenshot. Also, standard colors make it easier on the eyes.
Dmitry, I obviously disagree, more to the point, I think that the color is part of the application branding.
Speaking about the profiler's color scheme. It seems to be quite similar to your blog :>
Scooletz, Intentionally so.
Is the debugger available for public yet?
Thilak, It is part of the distro, yes.
Comment preview