Monitoring I/O inside of RavenDB
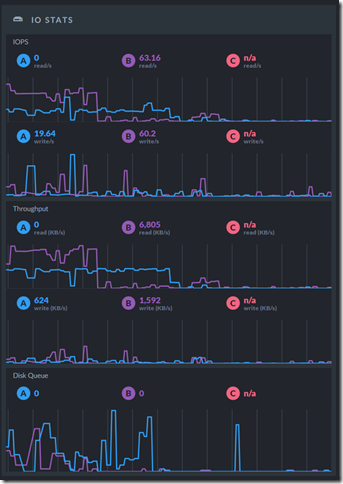
Earlier this year I talked about the reasoning behind the RavenDB team spending so much time building self monitoring diagnostics. Today I’m happy to announce that RavenDB has another such feature, allowing you to see, in real time, exactly what is going on in your database in terms of I/O.
You can see what this looks like in this image, RavenDB is showing you key metrics in terms of I/O utilization.
You can get the same metrics from your disk directly, and you have similar dashboards on all cloud infrastructure. For that matter, RavenDB Cloud also gives you access to this information. So why build that directly into RavenDB?
The answer is simple, putting that directly into RavenDB means that it is accessible. We don’t assume that a user has access / ability to see such data. For example, you may have access to the RavenDB instance, but not to the cloud account that is running it. Or you may not have sufficient permissions to view metrics data.
In many cases, even if they have access, they don’t know (or it wouldn’t occur to them to look at that). By reducing the amount of hassle you have to go through, we can make those metrics more accessible.
Remember, you probably aren’t looking for those numbers for fun. You need to troubleshoot some issue, and being able to directly see what is going on is key to quickly resolving a problem. For example, if you are seeing the disk queue length spiking a lot, you know that you are spending all of your I/O budget.
Just knowing that will let you direct your investigation in the right direction a lot sooner.


Comments
When is this going to be available in the RavenDB in AWS?
Bob,
That would be there in the next stable, probably in another 6 weeks
Comment preview