Analyzing five years of FitBit data
About five years ago, my wife got me a present, a FitBit. I didn’t wear a watch for a while, and I didn’t really see the need, but it was nice to see how many steps I took and we had a competition about who has the most steps a day. It was fun. I had a few FitBits since then and I’m mostly wearing one. As it turns out, FitBit allows you to get an export of all of your data, so a few months ago I decided to see what kind of information I have stored there, and what kind of data I can get from it.
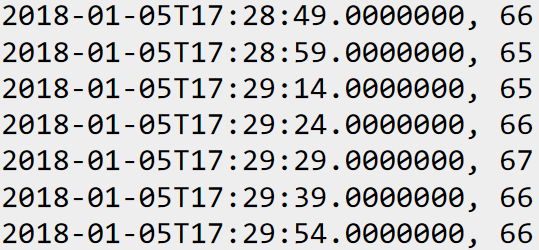
The export process is painless and I got a zip with a lot of JSON files in it. I was able to process that and get a CSV file that had my heartrate over time. Here is what this looked like:
The file size is just over 300MB and it contains 9.42 million records, spanning the last 5 years.
The reason I looked into getting the FitBit data is that I’m playing with timeseries right now, and I wanted a realistic data set. One that contains dirty data. For example, even in the image above, you can see that the measurements aren’t done on a consistent basis. It seems like ten and five second intervals, but the range varies. I’m working on a timeseries feature for RavenDB, so that was perfect testing ground for me. I threw that into RavenDB and I got the data to just under 40MB in side.
I’m using Gorilla encoding as a first pass and then LZ4 to further compress the data. In a data set where the duration between measurement is stable, I can stick over 10,000 measurements in a single 2KB segment. In the case of my heartrate, I can store an average of 672 entries in each 2KB segment. Once I have the data in there, I can start actually looking at interesting patterns.
For example, consider the following query:
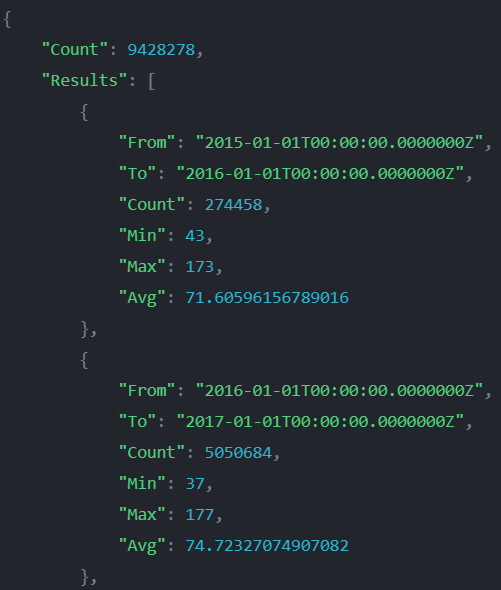
Basically, I want to know how I’m doing on a global sense, just to have a place to start figuring things out. The output of this query is:
These are interesting numbers. I don’t know what I did to hit 177 BPM in 2016, but I’m not sure that I like it.
What I do like is this number:
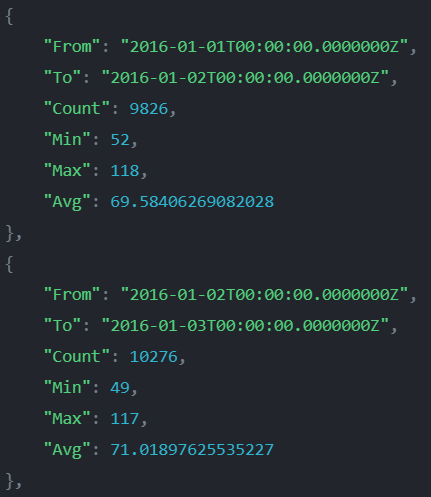
I then run this query, going for a daily precision on all of 2016:
And I got the following results in under 120 ms.
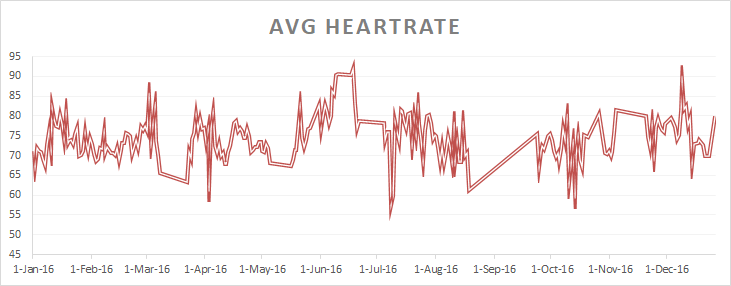
These are early days for this feature, but I was able to take that and generate the following (based on the query above).
All of the results has been generated on my laptop, and we haven’t done any performance work yet. In fact, I’m posting about this feature because I was so excited to see that I got queries to work properly now. This feature is early stages yet.
But it is already quite cool.


Comments
Would love to see that CSV as a download. It's fun following these kind of blog posts.
JustPassingBy, The code for this isn't really available yet. We'll have some sample data when we'll get this out completely.
It sounds like a great plan to add a timeseries feature. The performance results, is that based on cached data? Will you consider gapfilling strategies for empty timebuckets? Will you add "continuous" aggregates? And finally will there be a retention period on the raw data?
Christian, Right now, this is for the data without any caching. Good point on gap filling. What do you mean continuous aggregates? Our plan so far is to just retain the data, not downsample unless requested by user
Comment preview