RavenDB 4.0The Server Dashboard
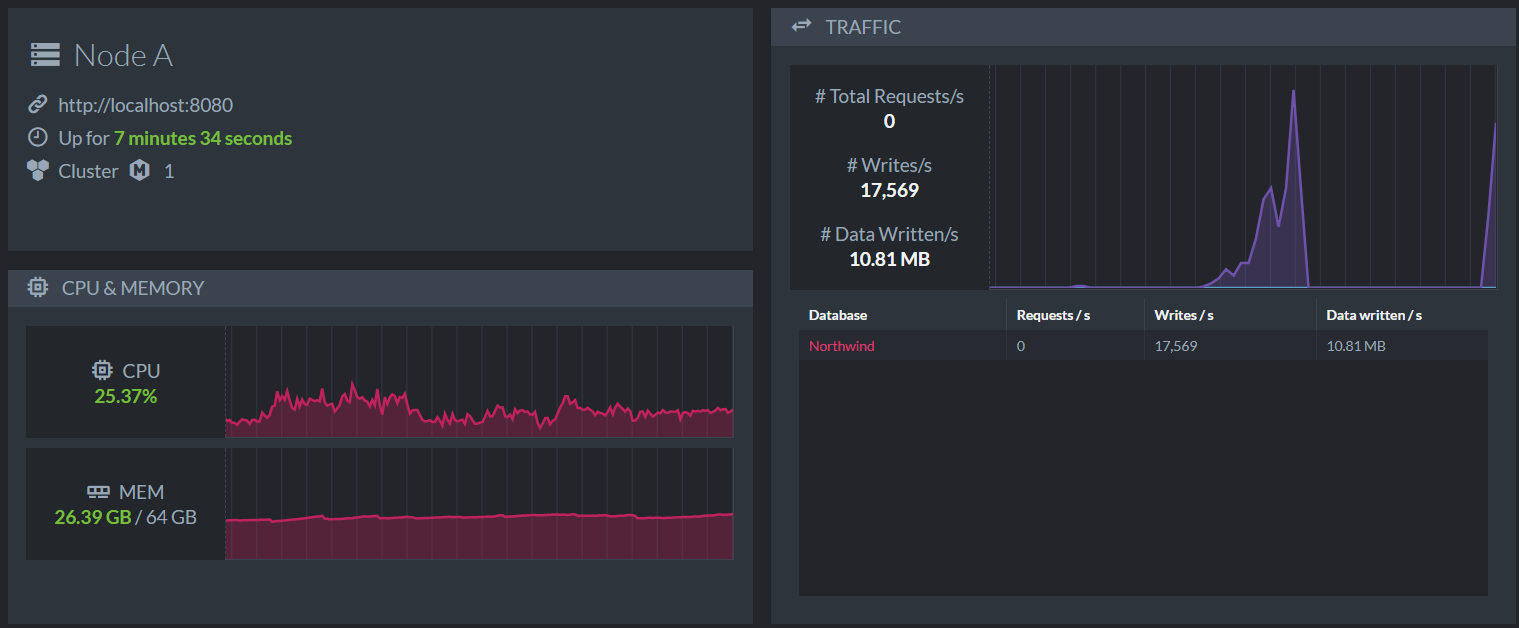
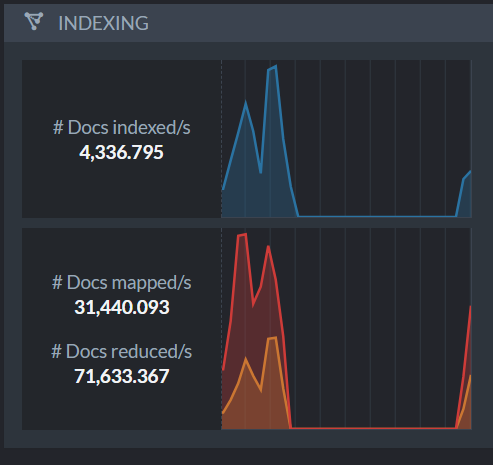
One of the things that we have been saving is the hooking together of all the work we have ben doing to expose how RavenDB works into the operations dashboard. This has just landed in the nightly and can give you a lot of insight into exactly what is going on inside your server.
You can see some of the screenshots below. The idea is that in addition to exposing all of these metrics over dedicated endpoints and SNMP, we will also save users the trouble of setting up monitoring and just show them what is going on directly.
Operators can just head to this page and see what is going on, and it is meant to be put as a background for users to observe this during routine operations.
More posts in "RavenDB 4.0" series:
- (30 Oct 2017) automatic conflict resolution
- (05 Oct 2017) The design of the security error flow
- (03 Oct 2017) The indexing threads
- (02 Oct 2017) Indexing related data
- (29 Sep 2017) Map/reduce
- (22 Sep 2017) Field compression


Comments
Is it already up and running for linux? I only see an empty dashboard, with uptime and URL filled, but the rest is empty or showing 0. Does look promising though
Derek, the Linux side of things was completed yesterday, so this should be up in the next nighlty.
The dashboard is awesome and cluster management became so much clearer! Thank you for the awesome and sharing the details
Comment preview