The memory leak in the network partition
RavenDB it meant to be a service that just runs and runs, for very long periods of time and under pretty much all scenarios. That means that as part of our testing, we are putting a lot of emphasis on its behavior. Amount of CPU used, memory utilization, etc. And we do that in all sort of scenarios. Because getting the steady state working doesn’t help if you have an issue, and then that issue kills you. So we put the system into a lot of weird states to see not only how it behaves, but what are the second order affects of that would be.
Once such configuration was a very slow network with a very short timeout setting, so effectively we’ll always be getting timeouts, and need to respond accordingly. We had a piece of code that is waiting for something to happen (an internal event, or a read from the network, or a timeout) and then does something accordingly.This is implemented as follows:
This is obviously extremely simplified, but it will reproduce the issue. If you will run this code, it will start using more and more memory. But why? On the face of it, this looks like a perfectly reasonable code.
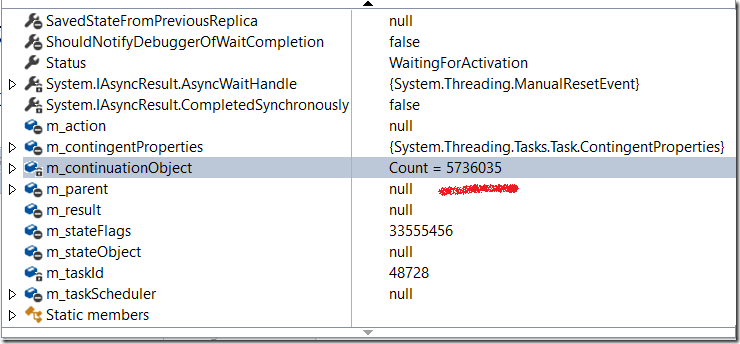
What is actually happening is that the WaitAny will call CommonCWAnyLogic, which will call an AddCompletionAction on that task, which will track it, so we have a list of items there. So if we have a lot of waits on the same task, that is going to cause us to track all of those waits.
Here is what it looks like after a short while in the debugger.
And there is our memory leak.
The solution, by the way, was to not call WaitAny each time, but to call WhenAny, and then call Wait() on the resulting task, and keep that task around until it is completed, so we only register to the original event once.


Comments
Why not using the library method of Wait with timeout? https://github.com/dotnet/coreclr/blob/master/src/mscorlib/src/System/Threading/Tasks/Task.cs#L2769
Mike, This is happening on an async call, we didn't want to stop the whole thread.
Is it not a problem, too, that all those delay tasks keep running until they expire? This might lead to an enormous accumulation of timers. The only way to deal with that which I found is to cancel the delay task using a CTS.
Probably the context is hidden too far... What I'm saying is the code in a gist does not make sense as in each iteration it waits for 1 ms on new task of 10000ms and some long running operation, instead of waiting for a single task of 10000ms.
That's how I read the code:
Task.WaitAny(longRunningTask, Task.Delay(10000), 1)and functional equivalent would belongRunningTask.Wait(1)while intent (according to my assumption)done = longRunningTask.Wait(10000)tobi, Yes, that is likely going to also be an issue which was resolved as well by the change. To be fair, the timeout was supposed to be 15 seconds, we just reduced it for testing to a lot less.
Mike, What is actually going on there is that we had a long running task, and another task and a timeout.
I took the liberty of reporting the memory leak and it is now fixed in .Net Core.
Svick, That is awesome!
Comment preview