RavenDB–Indexing performance timeline
We get people asking us about the details of RavenDB indexes, why a certain index is busy, what is costly, etc. This is a pretty common set of questions, and while we were always able to give the customer a good answer, I was never truly happy with that. A lot of that was about understanding the system to a very deep level and being able to read fairly obscure to an outsider. Like most things that aren’t obvious and easy to use, that bugged me, deeply. Therefor, we spent a few weeks adding internal metrics and exposing everything in a nice and easy fashion.
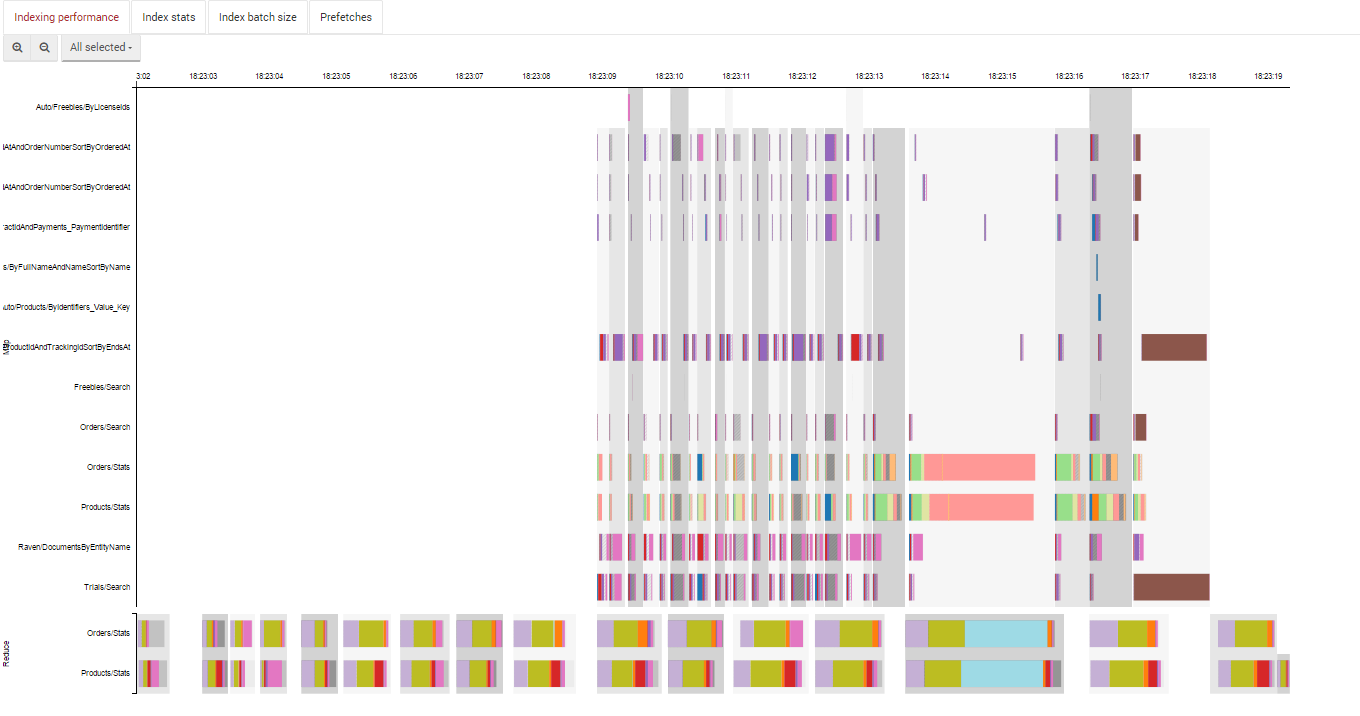
Let me show you the details from one of our production databases:
The Y axis is for different indexes. On the Y axis, you have time. Note that the top part is for map operations, and the bottom part is for reduce operations, and that they are running in parallel. You can also visually see that those the map & reduce are actually running in parallel.
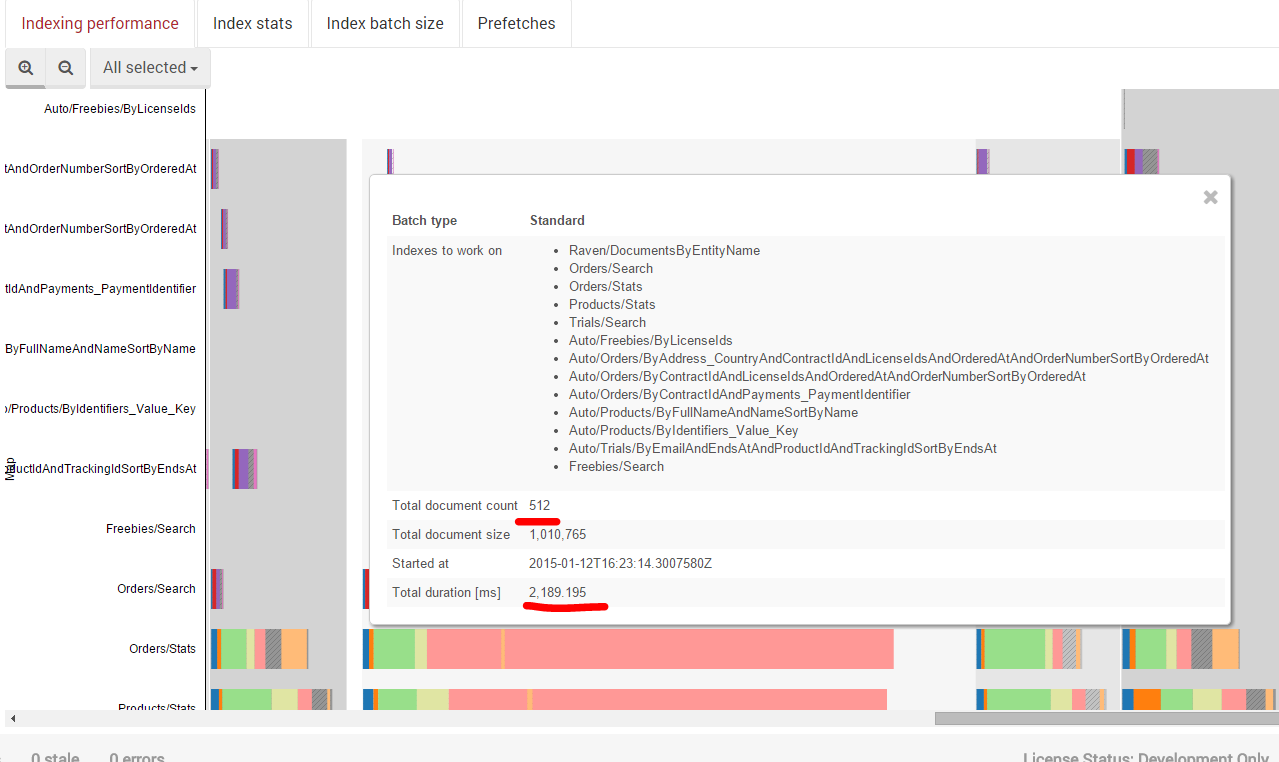
What is even better, you can visually see each individual indexing batch, let us focus on the long indexing batch in the middle:
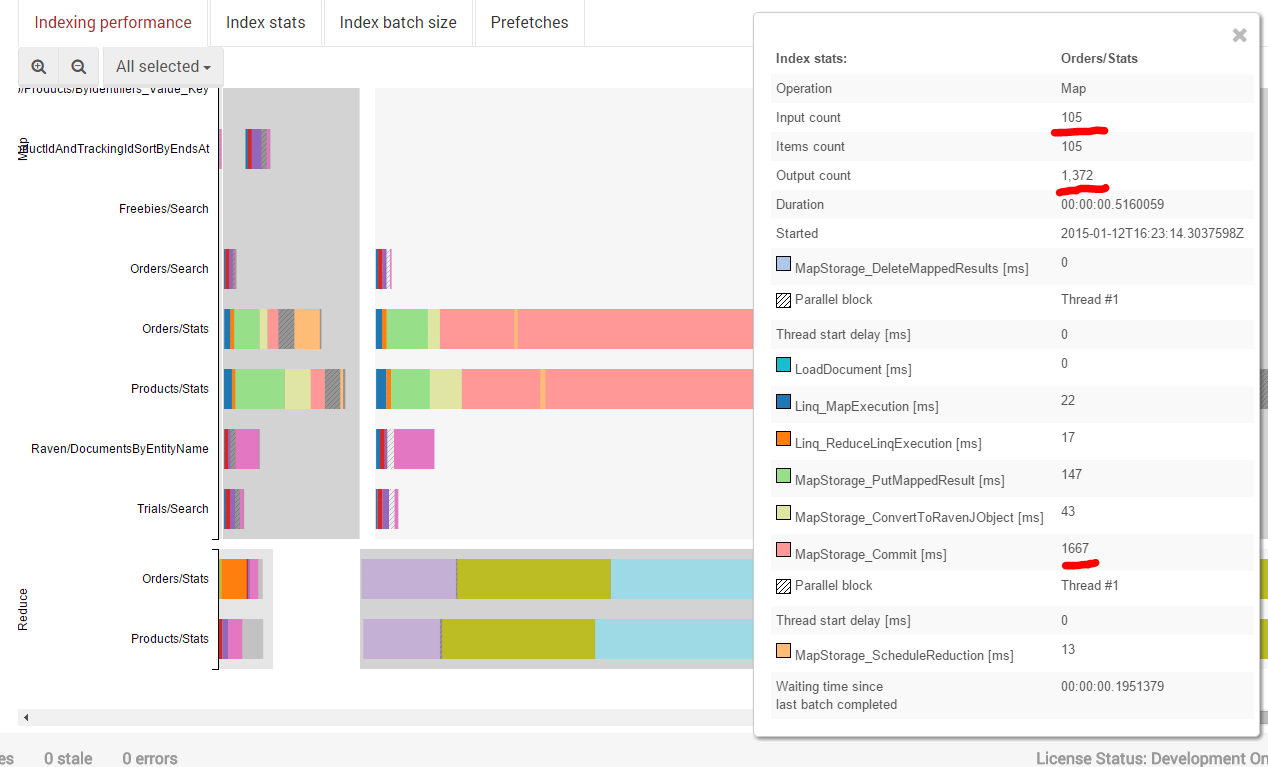
As you can see, we are indexing 512 documents, but it took us a really long time to index them, why is that? We can see that the reason that this batch took so long is that the Orders/Stats and Products/Stats index were very long. Clicking on them, we can see:
The Orders/Stats index accepted a 105 documents, and outputted 1,372 map values. And the costly part of this index was to actually commit those (along with the Products/Stats, which also output a similar amount) to the map storage.
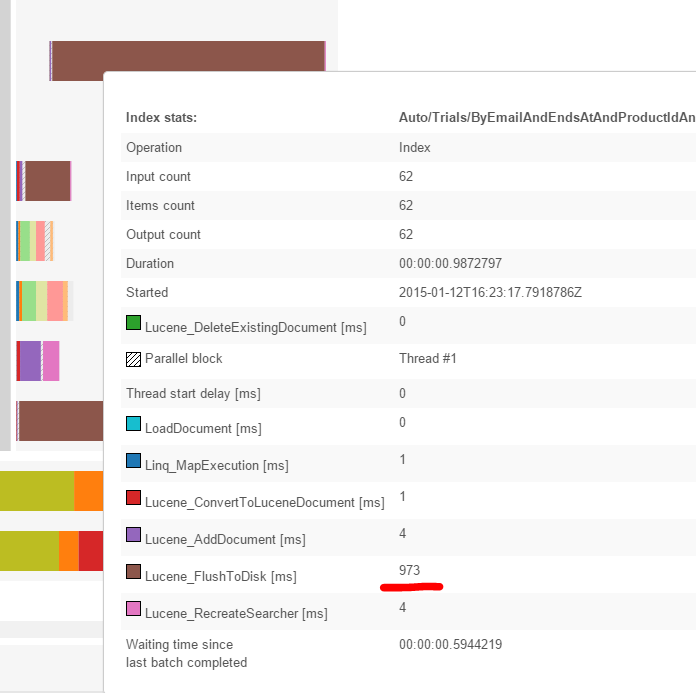
Another slow index is exposed here:
In this case, we have an index that is big enough that we need to flush it to disk from RAM. That explains things.
I’m really excited about this feature.


Comments
WOW!!! This is absolutely brilliant
So when will this be available in a stable version?
@Oren: very, very, very good! Btw "The Y axis is for different indexes. On the Y axis, you have time" I think or should be "X".
Great!
What do the different colors mean?
Forgot my silly question
Why did it take so long to write to disk? How many bytes did it have to store?
Very good stats and visual representation, but it would also be nice to the answers to my two questions. They would be the first thing my manager would ask in a similar situation.
Erik, In about a week or so
Douglas, The problem with measuring is that the act of measurement affect the the measurement. In other words, the more information we provide you, the more costly it is to actually provide that data. This data you see is always collected, so we want to keep it as light weight as possible. There are other ways to see what is going on in more details, this is meant to give you better understanding on what is going on so you can dig deeper.
In particular, you can use Resource Monitor to see I/O rates to certain files, which is something that is already very useful. What we are trying to do hear is to give you an idea, especially with compute bound tasks, so you can figure out what is actually going on internally, which is very hard to do with external tools
Comment preview