Production analysis and trouble shooting with RavenDB
The annoying thing about software in production is that it is a black box. It just sits there, doing something, and you have very little input into what. Oh, you can look at the CPU usage and memory consumption, you can try to figure out what is going on from the kind of things that the system will tell you this process is doing. But for the most part ,this is a black box. And not even one that is designed to let you figure out what just happened.
With RavenDB, we have made a very conscious effort to avoid being a black box. There are a lot of end points that you can query to figure out exactly what is going on. And you can use different endpoints to figure out different problems. But in the end, while that was very easy for us to use, those aren’t really meant for end users. They are meant for our support engineers, mostly.
We got tired of sending over “give me the output of the following endpoints” deal. We wanted a better story, something that would be easier and more convenient all around .So we sat down and thought about this, and came up with the idea of the Debug Info Package.
This deceptively simple tool will capture all of the relevant information from RavenDB into a single zip file that you can mail support. It will also give you a lot of details about the internals of RavenDB at the moment this was produced:
- Recent HTTP requests
- Recent logs
- The database configuration
- What is currently being indexed?
- What are the current queries?
- What tasks are being run?
- All the database metrics
- Current status of the pre-fetch queue
- The database live stats
And if that wasn’t enough, we have the following feature as well:
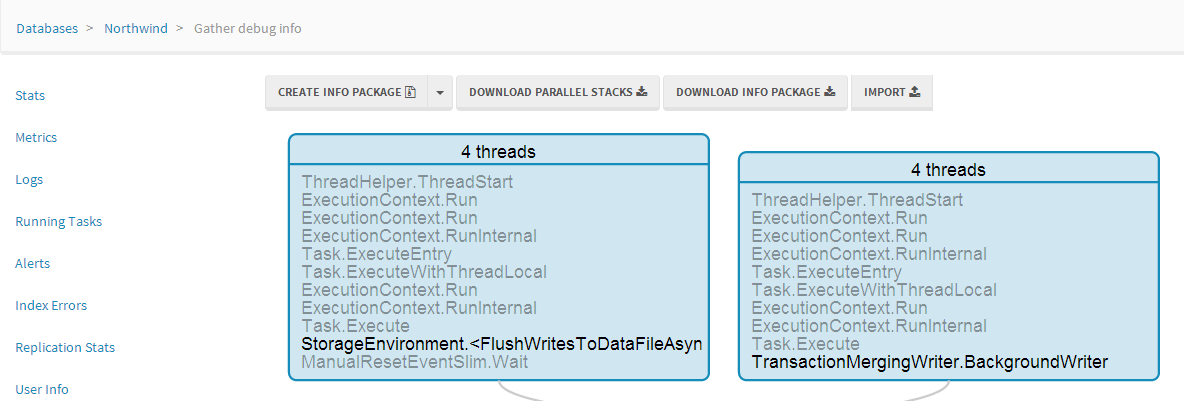
We get the full stack of the currently running process!
You can see how this look in full in the here:
But the idea is that we have cracked open the black box, and it is now so much easier to figure out what is going on!


Comments
Really a good job. Thank you.
Hm, and what if your database crashes or experiences some internal lockup/stops handling incoming requests? Will it be able to collect the information then?
Is this package going to be available for previous versions?
Rafal, If the entire server is down, you'll need to use other means, WinDBG, StackDump, etc. This is for diagnosing issues when the server is doing something strange, and you want to know what is going on.
Ian, No, that is a 3.0 feature
Do you know when a release candidate for 3 will be available?
Ian, 3 - 7 weeks.
This is by far the absolute #1 reason to consider upgrading to 3.0
No matter how great a resource is, when it's dead in the water and you can't figure out why, every minute counts.
One thing i note, if you click the image for "You can see how this look in full in the here:" that image is WAYYY too small. Needs to probably be 4-5x larger to be even remotely readable.
Chris, I updated the post to link to a bigger image.
Comment preview