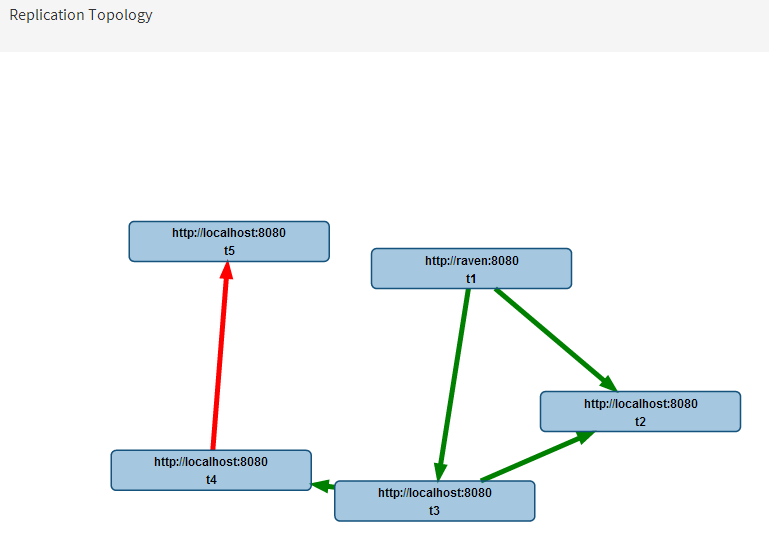
RavenDB Replication Topology Visualizer
Even more goodies are coming in RavenDB 3.0. Below you can see how to visualize the replication topology in a RavenDB Cluster. You can also see that the t5 database is down (marked as red).
This is important, since this gives us the ability to check the status of the topology from the point of view of the actual nodes. So a node might be up for one server, but not for the other, and this will show up here.
Beside, it is a cool graphic that you can use in your system documentation and it is much easier to explain ![]() .
.


Comments
Very cool. Is this part of the new HTML5 console?
Yes
groovy... when is it out? :P
Mike,
A range of 3 - 7 weeks.
Comment preview