Performance Testing with Voron OMG
I am not going to have a lot of commentary here, I think that I can let the numbers speak for themselves. Here are the current performance test of Voron vs. Esent on my machine.
Note, the numbers are in millions of writes per second here!
For Random Writes, the numbers are in thousands of writes per second:
Okay, I lied about no commentary. What you can see is that in our test, inserting 1.5 million items to storage. In sequential runs, we get such big variance because the test run itself is so short. (Nitpicker, yes, we’ll post longer benchmarks).
Note that this was running on a pretty good SSD drive, but what about HDD? Yes, that isn’t a mistake, Esent is doing 901 writes per second.


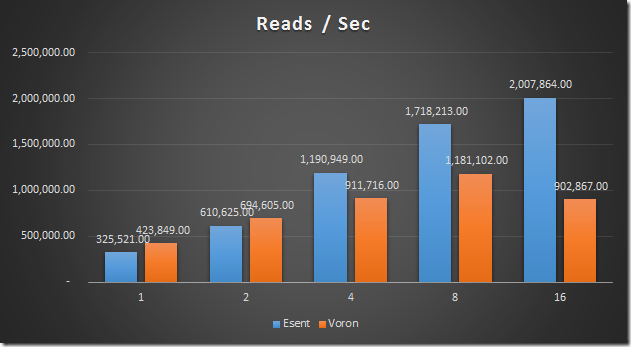
As we have seen, we are pretty good at reading, but what are the current results?
As you can see, we are significantly better than Esent for reads in single and dual threaded modes, but Esent is faster when it can use more threads.
That annoyed me, so I set out to figure out what was blocking us. As it turned out, searching the B-tree was quite expensive, but when I added a very small optimization (remember the last few searched pages), we saw something very interesting).
(The Esent results are different than the previous run because we run it on a different disk (still SSD)).
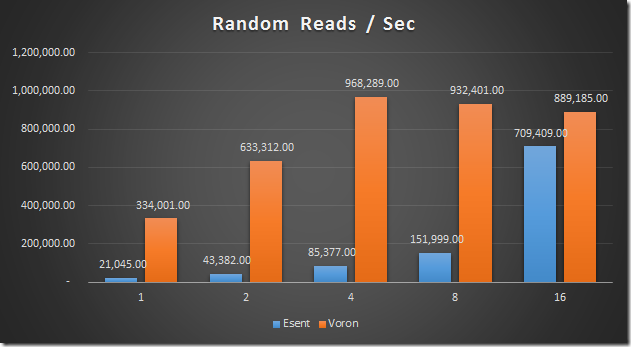
What about random reads?
Now, one area where we currently suck is large writes, where we are doing really bad, but we’re working on that.
Overall, I am pretty happy about it all.


Comments
WoW! Impressive. Its really coming nicely together!
I like to watch your way to a good performing storage engine but I really dislike the 2nd and 3rd image in this blogpost. It looks like voron has roughly the double performance of esent. Having not a 0 as the minimum of the y-axis looks like a marketing idea to me. I thought you are better than this :-(
I'm no database expert, but why did Esent's behavior in Reads/Sec get significantly worse after you did the optimization to Voron? My expectation would be that the numbers for Esent would stay the same or at least close. Something doesn't smell right to me. The numbers for Esent more than halved going from 2 Million reads to 1 Million reads. Are you running these benchmarks at the same time as each other and are they competing for resources?
@Khalid "(The Esent results are different than the previous run because we run it on a different disk (still SSD))." :)
@Fabian I agree, zero-base those axis!
I see, but why do that anyways? It just clouds the results imho and leaves room for doubt. Benchmarks (even rough ones) are normally done on a single machine. If the variables in the experiment keep changing then you don't have a reproducible result. These tests should state the hardware explicitly: CPU type, Operating System, Memory available, Disk (manufacturer preferably), and any tweaks to the system if performed. At first glance the numbers look good, but then I realize they really are just numbers given in a vacuum. I also agree that the Y axis should start at 0 like @Fabian said.
If you only show graphs, all we can complain about are the graphs :) My $.02: drop the decimals in the number labels, they will always be integers anyway. Looking forward to the freedb results.
If you only show graphs, all we can complain about are the graphs :) My $.02: drop the decimals in the number labels, they will always be integers anyway. Looking forward to the freedb results.
Khalid, The reason for that is that this blog post was written while we were developing things .And it was actually written on two different machines.
Fabian: Oh come on dont be silly, programmers should be able to read basic bar charts. If something smells here, go take a bath.
Comment preview