Architecture & Design Guidance, make the machine do your work for you
I am currently playing around with persistent B+Trees. This is done using memory mapped files and pointer arithmetic in C#. I consider this a non trivial exercise, and certainly quite outside of my usual haunts. Obviously, as you can imagine, there are bugs. Those can be really pretty hard to figure out, because they can arise from any number of issues (usually it is me, but still…).
After fighting for a few hours with a set of bus that just wouldn’t let me be, I decided that I had enough of that and set out to design the debug hooks I need to actually figure it out. Because I am dealing with pointers, I couldn’t just use the normal methods that I would use when debugging C# code. To top that, I think that most of you would agree that explaining a data structure (any data structure) without a whiteboard is nigh impossible. In the same manner, trying to figure out a bug in a B+Tree by following the member references was too hard. I wanted to actually visualize that.
I could throw it into a TreeView in a few minutes, but I wanted to take the time and do it right. I have a feeling that this is going to be useful for the future as well, so I learned how to use Graphviz’s dot language and wrote the code to dump the structure of the B+Tree into a properly formatted dot file, after which I could ask dot.exe to turn that into an image. The piece of code that I was having trouble with was the page split function.
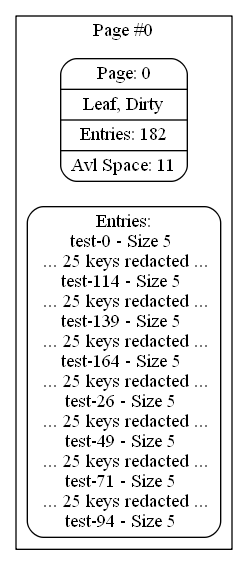
Here is the before snapshot, note that we have nearly run out of room in this page.
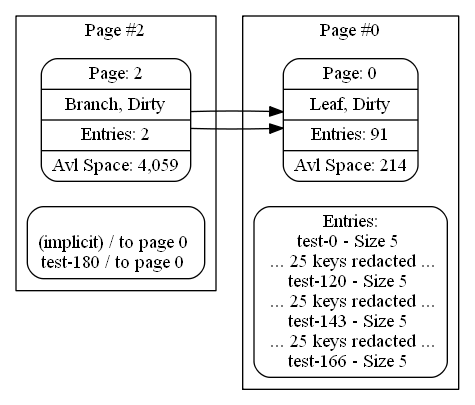
And here is the output of the after snapshot. As you can see, this really make no sense at all. We have a page split, but it all went into the same page?
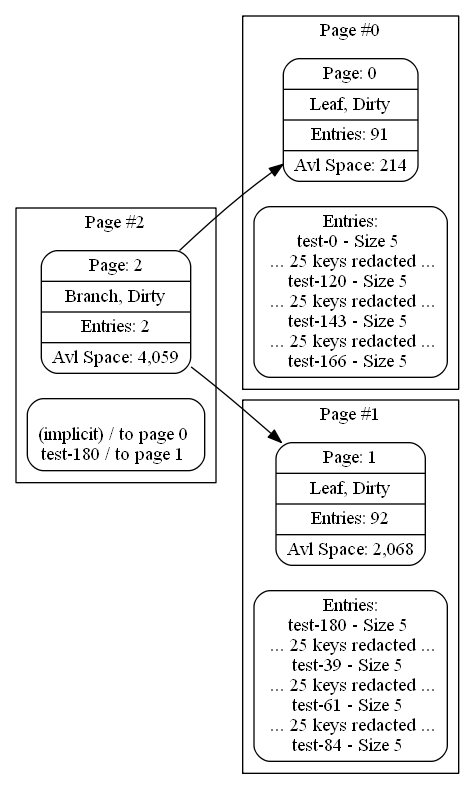
What actually happened is that I had a bug where I wired both the left and right pages in the split to the original page. Once that was fixed (and one I actually saw the data, it was very easy to see what is wrong). It was a matter of changing a single parameter. After the fix, I could visually see that everything was fine.
Leaving aside the details about the actual bug & fix. The lesson that I wish to impart today is that building those sort of capabilities into your systems is important. Now that I have this ability, I fully expect to be starting to using that when I need to debug the next issue.
In fact, I run into the next issue quite quickly. After inserting quite a lot of data, I messed up the pointers and returned what looked very much like corrupted data. It was pretty hard to isolate, as usual with pointer issues, since the actual error occurred at some point during the process, I wasn’t really clear on where and how to figure it out. I ended up just dumping the tree content to a file after every operation, and then checking the operations until I found the one where we start to have corruption.
That allowed me to figure out that the corruption began at step 98 iteration #4.
As it turned out, that was pretty hard to figure out, because I didn’t realize that when I was splitting the page, I needed to compact the data on the original page. Too much thinking in List<T> and not enough thinking about the layout of the problem in memory.


Comments
Had the same issue writing some graph algorithms. I remember at some point I wrote a DebugVisualizer for structures that can be "serialized" to dot so I could see the graph directly in Visual Studio debuger. If You are interested I could find it,test it with vs2012/13 and make it available on GitHub.
If You are interested drop me a line.
I've been using *.dgml files in Visual Studio. It's very easy to build a simple XML file listing just the links between nodes and it will draw the graph for you. In VS 2010 you could only use them in the Ultimate edition. In VS 2012 you can edit in Ultimate/Premium and view in Professional. Among other things, I've used it to visual our project dependencies. We have 1,000's of *.csproj files. :-(
Here is a trivial example of three nodes linked in a "circle": <?xml version="1.0" encoding="utf-8"?> <DirectedGraph xmlns="http://schemas.microsoft.com/vs/2009/dgml"> <Links> <Link Source="Node A" Target="Node B"/> <Link Source="Node B" Target="Node C"/> <Link Source="Node C" Target="Node A"/> </Links> </DirectedGraph>
Looks like your dog ate my XML. :-)
Let's try it with "(" and ")" instead of "<" and ">". You will have to reverse the munging yourselves. :-(
(?xml version="1.0" encoding="utf-8"?) (DirectedGraph xmlns="http://schemas.microsoft.com/vs/2009/dgml") (Links) (Link Source="Node A" Target="Node B"/) (Link Source="Node B" Target="Node C"/) (Link Source="Node C" Target="Node A"/) (/Links) (/DirectedGraph)
At least "pointer issues" are mostly defined behavior in C# whereas in C the program becomes completely undefined on the first invalid operation.
Comment preview