Optimized, but way out of line
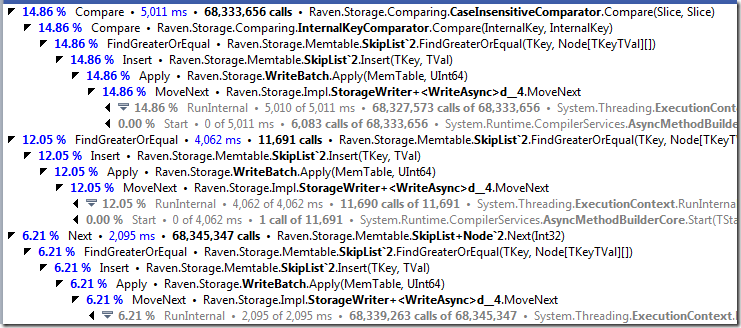
Yesterday I showed the following profiler results.
The first place someone would look at optimizing is the CaseInsensitiveComparator.Compare call, right? That is clearly taking a really long time.
In fact, we re-wrote that method to use pointer magic in order to get it to work faster. But that isn’t the issue. Look at the numbers. Compare is called 68 million times. That means that under the profiler, it is still completing an operation in 0.000073 ms. I am not even sure what time unit that is.
However, we can see that the major caller for Compare was FindGreaterOrEqual, right? And that is called only 11 thousand times. What does this tells you?
That tells me we have a Schlemiel the Painter's algorithm. So I double checked, and SkipList insert perf should be O(logN) on average. But what we were seeing is O(N) costs .Indeed, it appeared that we had a bug in which our skip list implementation would never do skips, essentially turning it into a sorted linked list, with insert perf of O(N). Once we fixed that bug… well, things got better, a lot better.
As you can see, the cost of this went down really hard. And now we can focus on other stuff.


Comments
Nice! btw, It's 73 nanoseconds.
I find the bottom-up view to be mostly useless. Top-down would have broken down the costs more clearly. Bottom-up tends to spread costs that logically belong together over many leaf methods.
dotTrace's display hierarchy looks confusing. Why is Next, FindGreaterOrEqual and Compare showing at the same level if one is calling the other? What's the order of execution.
Just wondering, what kind of "pointer magic" did you do to fix the CaseInsensitiveCompare?
So would it be feasible to create a profiler with an inbuilt Schlemiel detector, rather like the Entity Framework Profiler's SELECT n + 1 detector?
Rob,
Sure, technically speaking, that is pretty easy to do.
Comment preview