Oren Eini

CEO of RavenDB

a NoSQL Open Source Document Database

Get in touch with me:

oren@ravendb.net +972 52-548-6969

Posts: 7,546
|
Comments: 51,161
Privacy Policy · Terms
filter by tags archive
time to read 2 min | 316 words

Those are not actually new features, if you want to be strict about it. There is a whole bunch of things in NH Prof that already exists, but are only now starting to have an exposed UI.

I believe that NH Prof’s ability to analyze and detect problems in your NHibernate’s usage is one of the most valuable features that it have. Heavens know that I spent enough time on that thing to make it understand everything that I learned about NHibernate in 5 years of usage (how did it get to be that long)?

The problem is that NH Prof is not self aware yet, and assumptions about what is good practice or not cannot be made in vacuum, they must be made in context, which NH Prof lacks. As such, it is possible that you’ll find yourself inundated with alerts that aren’t valid for your scenario.

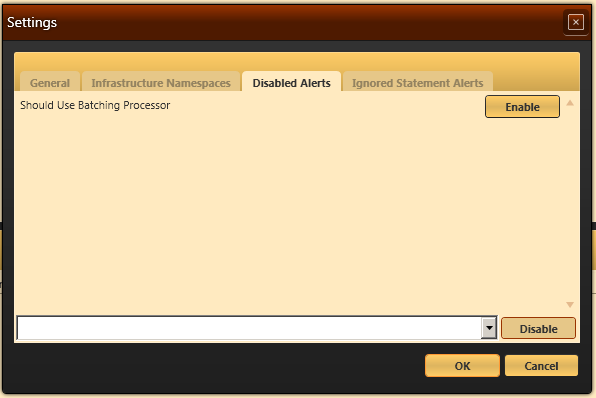
A typical example would be that for your project, which uses MySql, you cannot use NHibernate’s batching (which isn’t supported on MySql). Therefore, the batching alert is not only invalid, it is actually annoying. You can globally disable an alert from the settings dialog:

image

But that is like whacking flies with a rifle. It will kill all the alerts of that type. What about when you want to ignore a specific alert in a specific circumstance?

NH Prof supports this as well: 

image

The profiler is smart enough to ignore the same alert from the same source in the future.

Of course, we can also remove ignored alerts from the settings dialog as well.

time to read 1 min | 137 words

Hat tip to Chad Myers for requesting those features.

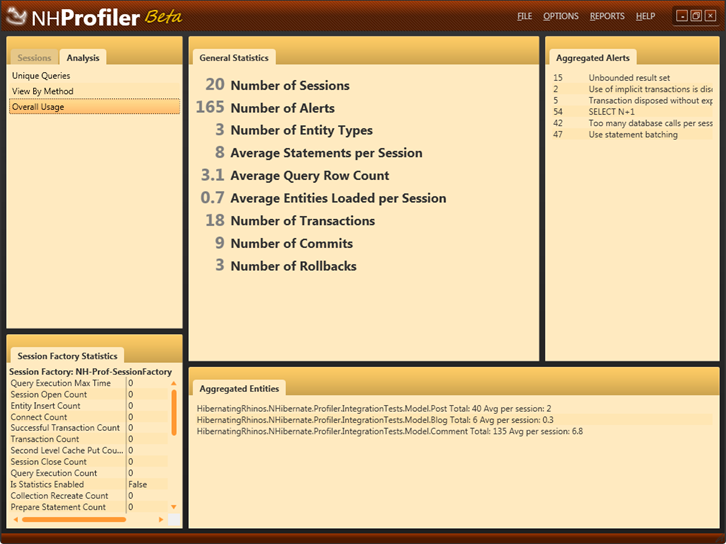
Here is an example of the overall usage report for the entire application.

image

The aggregated alerts gives you a view about how your application is doing. As you can probably see, this isn't a very healthy application. But since this is actually showing the test suite for the profiler, I am happy with that. On the bottom, you can also see what entities where loaded throughout the entire profiling session, although this is not their final look & feel.

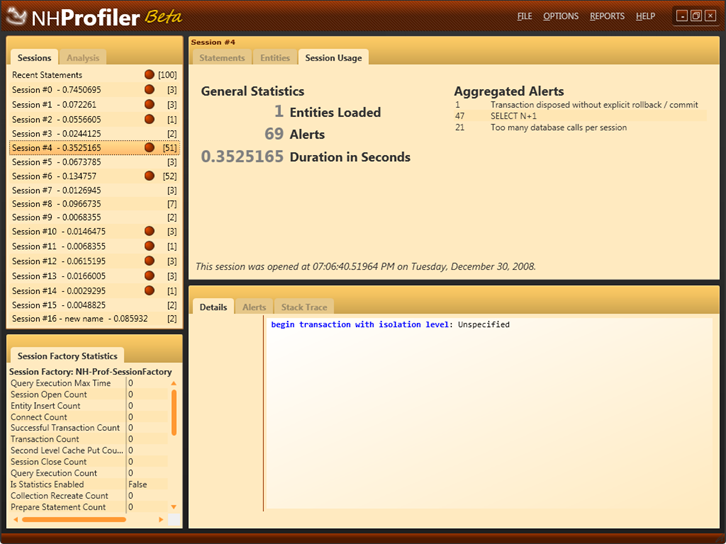
We can also see inspect the details of a particular session.

image

Again, this is probably not a healthy code base :-) But that is why I created the profiler for.

time to read 1 min | 165 words

I have been quite on that front for a while, but not because we stopped working on that, but because we were quietly adding features and polishing what we have to reach a whole new level.

Some of those features are not yet complete, but we have one feature that is good enough to show.

Analysis

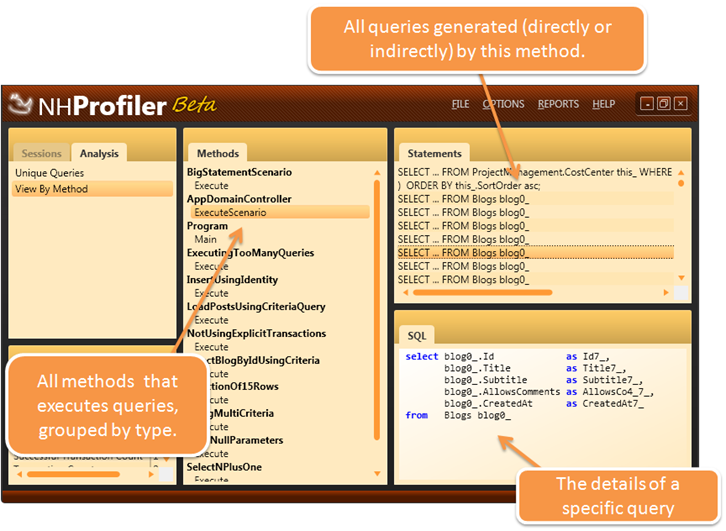
In this case, a picture is worth significantly more than a thousand words.

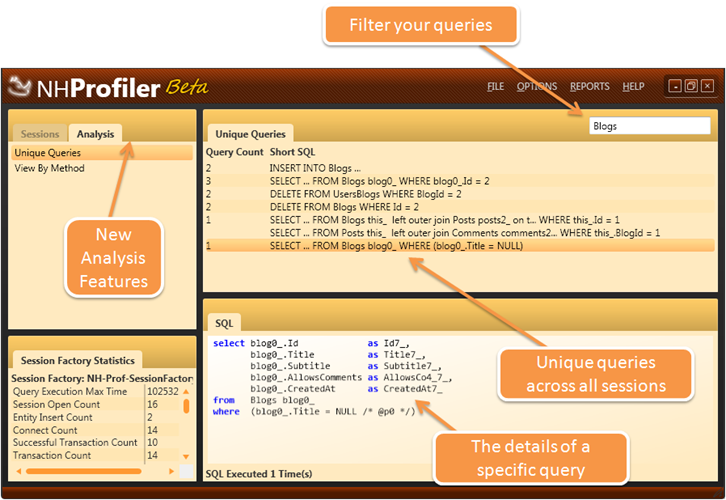
Here is one of the analysis modes that we support, showing you all the unique queries that you application perform.

image

But wait, there is more. The (tentatively named) View By Method:


image

This features should both allow you to gain a much higher level of understanding in regard to how exactly you are using NHibernate. Not to mention that these also give you a high level overview about what is going on.

What do you think?

FUTURE POSTS

  1. Partial writes, IO_Uring and safety - about one day from now
  2. Configuration values & Escape hatches - 4 days from now
  3. What happens when a sparse file allocation fails? - 6 days from now
  4. NTFS has an emergency stash of disk space - 8 days from now
  5. Challenge: Giving file system developer ulcer - 11 days from now

And 4 more posts are pending...

There are posts all the way to Feb 17, 2025

RECENT SERIES

  1. Challenge (77):
    20 Jan 2025 - What does this code do?
  2. Answer (13):
    22 Jan 2025 - What does this code do?
  3. Production post-mortem (2):
    17 Jan 2025 - Inspecting ourselves to death
  4. Performance discovery (2):
    10 Jan 2025 - IOPS vs. IOPS
View all series

Syndication

Main feed Feed Stats
Comments feed   Comments Feed Stats
}