Oren Eini

CEO of RavenDB

a NoSQL Open Source Document Database

Get in touch with me:

oren@ravendb.net +972 52-548-6969

Posts: 7,546
|
Comments: 51,162
Privacy Policy · Terms
filter by tags archive
time to read 1 min | 95 words

IconI am now discussing what sort of reports we want to give the DBA from the NHibernate Profiler. My first thought was just to give the DBA a list of the statements that the application has executed and the number of times they were repeated.  That should allow him to get enough information to use his own tools to optimize the application physical data structure.

What do you think? Is this a good scenario?

What other scenarios can you see for NH Prof in the hands of the DBA?

time to read 3 min | 509 words

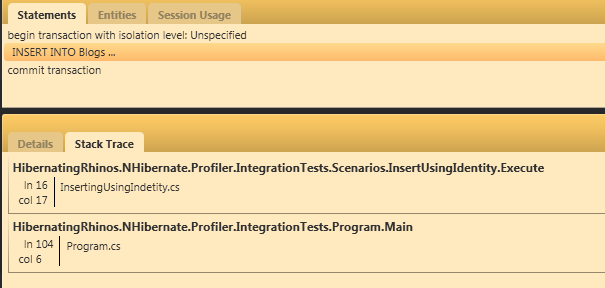
One of the nicest features that NH Prof has to offer is this, allowing you to go from the query issued to the database directly to the line of code that caused this query to be generated. Icon

image 

A few days ago I posted that you can either build something in one day, or in three months, but nothing much in the middle. The proof of concept that convinced me that I can build NH Prof was written during a single evening, along with two pints of Guinness. The overall concept that I have now is drastically different, but it is that evening that made sure that I would start it.

However, I wanted to use this opportunity to talk about some of the things that take a one day project and stretch it into three months. In this case, the query to line of code is a good feature, because it looks simple. After all, the only thing that I need to do, basically, is just to use the built in facility to get the stack trace, and extrapolate from there. Well, even for the normal case, that is not so easy. There are issues of user experience that play a deciding role in how we are going to deal with this.

But this isn't what was really challenging. The challenging part came from the law of least surprises. That is, if I am providing a stack trace for queries, I should provide them for all queries. As it turned out, there was one scenario in which I am not able to give a complete stack trace. When we are mixing queries generated as a result of a lazy proxy being instantiated. On the whole, this is a minor concern, but it really bugged me. You would get a stack trace that just ended in some weird type that you never seen before.

At that point, I felt like I had to solve this.

Let us go back and outline the problem. Stack traces relies on PDBs to do their work. NHibernate's lazy proxies are generated at runtime, have no PDBs and mask the actual call to the method / property that we are actually are interested in. The mix of the two wasn't encouraging, I must say.

Given that, I decided to pull out the big guns, and started messing with the PDB myself. Obviously, I don't want to do it on my own, that is why Cecil is so useful. But it was still a bit tricky to get it right. And the funny part is that I am pretty certain that this is one feature that absolutely no one will actually notice. If it wasn't there, however, people would notice.

Anyway, it 3:30 AM here, and for some reason I managed to do more work tonight than in the previous week(!). NH Prof is now in private beta, and I hope to be able to take it to public beta in a few weeks.

time to read 2 min | 321 words

One of the goals that I set for myself with the NHibernate Profiler is to be able to run on unmodified NHibernate 2.0. The way that I do that is by intercepting and parsing the log stream from NHibernate.

NHibernate logging is extremely rich and detailed, so anything I wanted to do so far was possible. I am pretty sure that there would come a time when a feature would require more invasive approaches, running profiler code in the client application to gather more information, but for now this is enough.

I did run into several problems with logging interception. Ideally, I want this to happen on the fly, as we go. So I really want to get the real time logging stream. The problem is how to do so. I started with the UdpAppender, but that doesn't work on Vista in the released version. Remoting Appender is what I am using now, but it has one critical issue, it is an async appender, so message can (and do) appear out of order.

The message order is pretty important to the profiler. It can deal with that, but it would lead to surprising results. So that one is out as well.

The only other appender that comes out of the box with log4net and can be used remotedly is the telnet appender, which is next on the list for exploring. It does mean that the profiler has to connect to the application, rather than the other way around, which can be a problem.

I built an appender that fit my needs, and I am using it now to test how the profiler works, but before starting to deal with the telnet appender, I thought it would be a good time to ask.

How important is "running on unmodified NHibernate" is?

I am not talking about having a profiler build of NHibernate, I am talking about doing things like using the profiler appender, or registering an HttpModule.

time to read 2 min | 353 words

I just finished writing the final test for the basic functionality that I want for NHibernate Profiler:

        [Test]
public void SelectBlogById()
{
ExecuteScenarioInDifferentProcess<SelectBlogByIdUsingCriteria>();
StatementModel selectBlogById = observer.Model.Sessions.First()
.Statements.First();
const string expected = @"SELECT this_.Id as Id3_0_,
this_.Title as Title3_0_,
this_.Subtitle as Subtitle3_0_,
this_.AllowsComments as AllowsCo4_3_0_,
this_.CreatedAt as CreatedAt3_0_
FROM Blogs this_
WHERE this_.Id = @p0

";
Assert.AreEqual(expected, selectBlogById.Text);
}

I actually had to invest some thought about the architecture of testing this. This little test has a whole set of ideas behind it, about which I'll talk about at a later date. Suffice to say that this test creates a new process, start to listen to interesting things that are going on there (populating the observer model with data).

Another interesting tidbit is that the output is formatted for readability. By default, NHiberante's SQL output looks something like this:

SELECT this_.Id as Id3_0_, this_.Title as Title3_0_, this_.Subtitle as Subtitle3_0_, this_.AllowsComments as AllowsCo4_3_0_, this_.CreatedAt as CreatedAt3_0_ FROM Blogs this_ WHERE this_.Id = @p0

This is pretty hard to read the moment that you have any sort of complex conditions.

FUTURE POSTS

  1. Partial writes, IO_Uring and safety - about one day from now
  2. Configuration values & Escape hatches - 4 days from now
  3. What happens when a sparse file allocation fails? - 6 days from now
  4. NTFS has an emergency stash of disk space - 8 days from now
  5. Challenge: Giving file system developer ulcer - 11 days from now

And 4 more posts are pending...

There are posts all the way to Feb 17, 2025

RECENT SERIES

  1. Challenge (77):
    20 Jan 2025 - What does this code do?
  2. Answer (13):
    22 Jan 2025 - What does this code do?
  3. Production post-mortem (2):
    17 Jan 2025 - Inspecting ourselves to death
  4. Performance discovery (2):
    10 Jan 2025 - IOPS vs. IOPS
View all series

Syndication

Main feed Feed Stats
Comments feed   Comments Feed Stats
}