Oren Eini

CEO of RavenDB

a NoSQL Open Source Document Database

Get in touch with me:

oren@ravendb.net +972 52-548-6969

Posts: 7,546
|
Comments: 51,163
Privacy Policy · Terms
filter by tags archive
time to read 4 min | 762 words

In my previous post I showed a performance conundrum. A code that has been optimized to reduced heavy allocation usage that became over twice as slow.

In particular, we had a problem here, the new code it 3.4 times slower than the new one, but how?

image

Now, the real scenario we had involved concurrent access, so it was much harder to figure out, but I cheated a bit when producing this image, I used sampling profiling, instead of tracing one. The major difference between the two is that tracing profiler will also give you the number of calls. This is called out as something that you would typically do because you want to analyze algorithmic complexity, but I find it incredibly useful to figure out what my code is actually doing.

And indeed, looking at the same code using tracing profiler gives us the following two calls:

image

image

And when looking at the diffs between those two, we have:

image

So for some reason we are making 54 million more calls to the Equals method in the optimized version, but why? Both of those are using the exact same dictionary, using the exact same key type and the same keys, even.

In the real scenario we were facing, that wasn’t the case, so that made it hard to analyze the issue. We started looking into whatever we were doing some sort of cache poisoning by having the buffer holder as the dictionary value, instead of the array directly, but that didn’t pan out. We kept circling around the number of Equals calls. Note that the number of calls to TryGetValue is the same, as well as the number of calls to GetHashCode. So what is the diff?

The diff, quite simple, is not here at all.

The problem is in the RemoveBefore method. In the old version, if we removed all the entries, we’ll remove it completely from the dictionary. In the new version, we’ll reset the buffer so it can be used again next time. The problem with that approach is that it means that the dictionary is pretty big, much bigger than it would be in the case of the old version of the code. And that means that we’ll need to find the value (which is empty), then check its content. On the old version, we’ll just do a GetHashCode, then find that the table entry is over, and exit.

Indeed, all we had to do was change RemoveBefore to look like this:

And that gives us:

  • 14.0 seconds & 1.1 GB of memory for old version
  • 12.8 seconds & 0.4 GB of memory for new version

Which is pretty good result overall. It gets better when you break it apart to its component parts.

image

This is actually surprising, since we didn’t really set out to optimize this call very much, and it is pretty much unchanged in both versions. I think that this is likely because we keep the buffers around longer, so they are more likely to be in the cache.

image

This shows more than double the speed we previous had, which is pretty awesome, since this code is actually called per transactions, so anything that reduces that cost is golden.

image

This happens during a flush, and reducing its speed is important to reducing the time we hold the write lock, so this is pretty sweet.

time to read 4 min | 629 words

PageTable is a pretty critical piece of Voron. It is the component responsible for remapping modified pages in transactions and is the reason why we support MVCC and can avoid taking locks for the most part. It has been an incredibly stable part of our software, rarely changing and pretty much the same as it was when it was initially written in 2013. It has been the subject for multiple performance reviews in that time, but acceptable levels of performance from our code in 2013 is no longer acceptable today. PageTable came up recently in one of our performance reviews as a problematic component. It was responsible for too much CPU and far too many allocations.

Here is a drastically simplified implementation, which retain the salient points:

Here is the sample workout for this class, which just simulates ten thousand transactions. This little scenario takes 15.3 seconds and allocates a total of 1.1GB of memory! That is a lot of allocations, and must have tremendous amount of time spent in GC. The most problematic issue here is the SetItems methods, which will allocate two different delegates for each modified page in the transaction. Then we have the total abandon in which we’ll allocate additional memory in there. As you can imagine, we weren’t very happy about this, so we set out to fix this issue.

We can take advantage off the fact that SetItems and RemoveBefore are only called under lock, while TryGetValue is called concurrently with everything else.

So I wrote the following code:

This relies on allowing stale reads from concurrent readers, which we don’t care about since they wouldn’t be able to make use of the data anyway, and it was able to reduce the allocations to just 320 MB, but the runtime actually went up to 32 seconds.

That is quite annoying, as you can imagine, and much cursing enthused as a result. I then pulled my trusty profiler ask it kindly to figure out what piece of code needs to be hit with a rolling pin and have a stern talk to about what is expected from code after it has been laboriously and carefully optimized. It is expected to sit nicely and be fast, or by Git I’ll revert you.

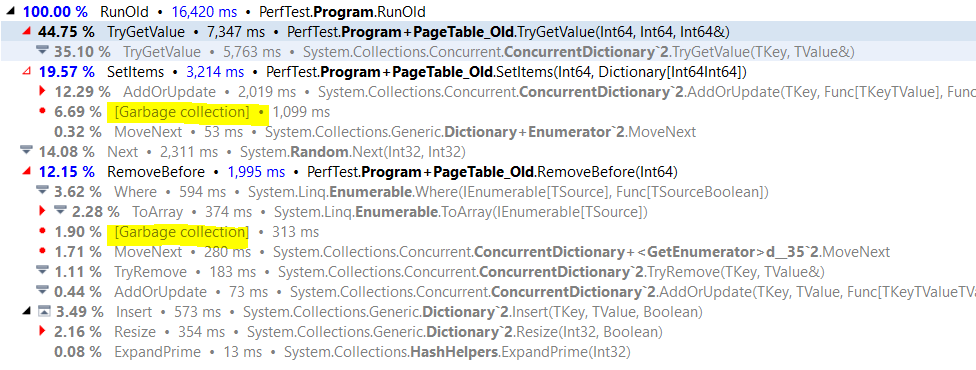
What the hell?! Here are the original implementation costs, and you can clearly see how much time we are spending on garbage collection.

image

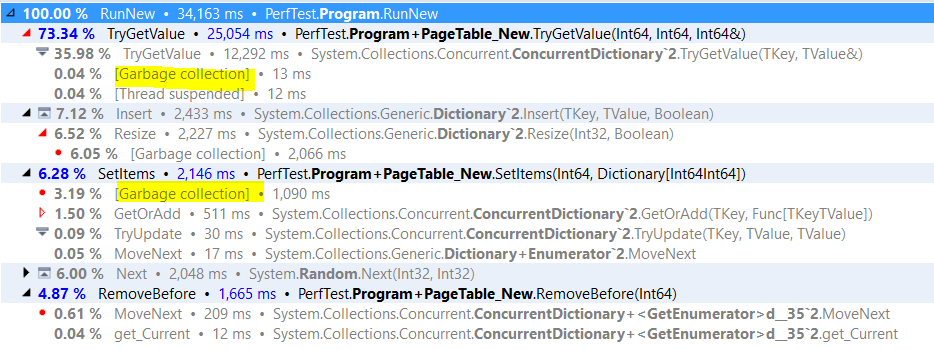
And here is the optimized version, which is actually slower, and actually used more memory?!

image

There are a bunch of interesting things going on here. We can see that we are indeed using spending a little less time in GC, and that both RemoveBefore and SetItems methods are much cheaper, but the cost of TryGetValue is so much higher, in fact, if we compare the two, we have:

image

So we are 3.4 times higher, and somehow, the cost of calling the concurrent dictionary TryGetValue has risen by 88%.

But the implementation is pretty much the same, and there isn’t anything else that looks like it can cause that much of a performance gap.

I’ll leave this riddle for now, because it drove me crazy for two whole days and give you the details on what is going on in the next post.

FUTURE POSTS

  1. Partial writes, IO_Uring and safety - 5 hours from now
  2. Configuration values & Escape hatches - 3 days from now
  3. What happens when a sparse file allocation fails? - 5 days from now
  4. NTFS has an emergency stash of disk space - 7 days from now
  5. Challenge: Giving file system developer ulcer - 10 days from now

And 4 more posts are pending...

There are posts all the way to Feb 17, 2025

RECENT SERIES

  1. Challenge (77):
    20 Jan 2025 - What does this code do?
  2. Answer (13):
    22 Jan 2025 - What does this code do?
  3. Production post-mortem (2):
    17 Jan 2025 - Inspecting ourselves to death
  4. Performance discovery (2):
    10 Jan 2025 - IOPS vs. IOPS
View all series

Syndication

Main feed Feed Stats
Comments feed   Comments Feed Stats
}