Oren Eini

CEO of RavenDB

a NoSQL Open Source Document Database

Get in touch with me:

oren@ravendb.net +972 52-548-6969

Posts: 7,546
|
Comments: 51,161
Privacy Policy · Terms
filter by tags archive
time to read 2 min | 376 words

After talking about transaction merging, there is another kind of database trick that you can use to optimize your performance even further. It is called early lock release. With early lock release, we rely on the fact that the client will only know when the transaction has been committed after we told him. And that we don’t have to tell it right away.

That sounds strange, how can not telling the client that its transaction has been committed improve performance. Well, it improve throughput, but it can also improve the performance. But before we get into the details, let us see the code, and then talk about what it means:

The code is nearly identical to the one in the previous post, but unlike the previous post, here we play a little game. Instead of flushing the journal synchronously, we are going to do this in an async manner. And what is more important, we don’t want for it to complete. Why is that important?

It is important because notifying the caller that the transaction has been complete has now moved into the async callback, and we can start processing additional operations are write them to the journal file at the same time that the I/O for the previous operation completes.

As far as the client is concerned, it doesn’t matter how it works, it just need to get the confirmation that it has been successfully committed. But from the point of view of system resources, it means that we can parallelize a key aspect of the code, and we can proceed with the next set of transactions  before the previous one even hit the disk.

There are some issues to consider. Typically you have only a single pending write operation, because if the previous journal write had an error, you need to abort all future transactions that relied on its in memory state (effectively, rollback that transaction and any speculative transactions we executed assuming we can commit that transaction to disk. Another issue is that error handling is more complex, if a single part of the merge transaction failed, it will fail unrelated operations, so you need to unmerge the transaction, run them individually, and report on each operation individually.

time to read 4 min | 790 words

A repeating choice that we have to make in databases is to trade off performance for scale. In other words, in order to process more requests per time frame, we need to increase the time it takes to process a single request. Let’s see how this works with the case of transaction commits.

In the simplest model, a transaction does its work, prepares itself to be committed, writes itself to the journal, and then notifies the client that it has successfully committed. Note that the most important part of the process is writing to the journal, which is how the transaction maintains durability. It also tends to be, by far, the most expensive part of the operation.

This leads to a lot of attempts to try and change the equation. I talked about one such option when we talked about the details of the transaction journal, having a journal actor responsible for writing the transaction changes as they happen, and amortize the cost of writing them over time and many transactions. This is something that quite a few databases do, but that does have certain assumptions.

To start with, it assumes that transactions are relatively long, and spend a lot of their time waiting for network I/O. In other words, this is a common model in the SQL world, where you have to open a connection, make a query, then make another query based on the results of that, etc. The idea is that you parallelize the cost of writing the changes to the journal along with the time it takes to read/write from the network.

But other databases do not use this model. Most NoSQL databases use the concept of a single command (which may aggregate commands), but they don’t have the notion of a long conversation with the client. So there isn’t that much of a chance to spread the cost of writing to the journal on the network.

Instead, a common trick is transaction merging. Transaction merging relies on the observation that I/O costs are no actually linear to the amount of I/O that you use. Oh, sure, writing 1KB is going to be faster than writing 10 MB. But it isn’t going to be two orders of magnitude faster. In fact, it is actually more efficient to make a single 10MB write than 1024 writes on 1 KB. If this make no sense, consider buying groceries and driving back to your house. The weight of the groceries has an impact on the fuel efficiency of the car, but the length of the drive is of much higher importance in terms of how much fuel is consumed. If you buy 200 KG of groceries (you are probably planning a hell of a party) and drive 10 KB home, you are going to waste a lot less fuel then if you make 4 trips with 50 KG in the trunk.

So what is transaction merging? Put simply, instead of calling the journal directly, we queue the operation we want to make, and let a separate thread run through all the concurrent operations. Here is the code:

The secret here is that if we have a load on the system, by the time we read from the queue, there are going to be more items in there. This means that when we write to the journal file, we’ll write not just a single operation (a trip back & forth to the grocery store), but we’ll be able to pack a lot of those operations immediately (one single trip). The idea is that we buffer all of the operations, up to a limit (in the code above, we use time, but typically you would also consider space), and then flush them to the journal as a single unit.

After doing this, we can notify all of the operations that they have been successfully completed, at which point they can go and notify their callers. We traded off the performance of a single operation (because we now need to be more complex and pay more I/O) in favor of being able to scale to a much higher number of operations. If your platform support async, you can also give up the thread (and let some other request run) while you are waiting for the I/O to complete.

The number of I/O requests you are going to make is lower, and the overall throughput is higher. Just to give you an example, in one of our tests, this single change moved us from doing 200 requests / second (roughly the maximum number of fsync()/ sec that the machine could support) to supporting 4,000 requests per second (x20 performance increase)!

time to read 3 min | 519 words

image[3]

In my previous post I talked about the journal and how it is used to recover the database state in case of errors.

In other words, we write everything that we are going to do into the journal, and the code is written to run through the journal and apply these changes to the database.

Ponder this for a moment, and consider the implications of applying the same concept elsewhere. Log shipping is basically taking the journal file from one server and asking another server to apply it as well. That is all.

Everything else are mere details that aren’t really interesting… Well, they are, but first you need to grasp what is so special in log shipping. If you already have a journal and a recovery from it, you are probably at least 80% or so of the way there to getting log shipping to work.

Now that you understand what log shipping is, let’s talk about its implications. Depending on the way your log is structured, you might be able to accept logs from multiple servers and apply all of them (accepting the fact that they might conflict), but in practice this is almost never done in this manner. Log shipping typically mandates that one server would be designated the master (statically or dynamically), and the other(s) are designated as secondary (typically read only copies).

The process in which the logs are shipped is interesting. You can do that on a time basis (every 5 – 15 minutes), every time that you close a journal file (64MB – 256MB), etc. This is typically called offline log shipping, because there is a large gap between the master and the secondary. There is also online log shipping, in which every write to the journal is also a socket write to the other server, which accepts the new journal entries, write them to its own journal and applies them immediately, resulting in a much narrower delay between the systems.  Note that this has its own issues, because this is now a distributed system with all that it implies (if the secondary isn’t available for an hour, what does it mean, etc.).

But journals also allow us to do other fun stuff. In particular, if the journal file records the timestamp of transactions (and most do), they allow us to do what is called “point in time” recovery. Starting from a particular backup, apply all the committed transactions until a certain point in time, bring up to the state of the database at 9:07 AM (one minute before someone run an UPDATE statement without the WHERE clause).

Note that all of the code that actually implements this has already been written as part of ensuring that the database can recover from errors, and all we need to implement “point in time” recovery is to just stop at a particular point in time. That is a pretty neat thing, in my opinion.

time to read 8 min | 1413 words

I talk a lot about journals, and how to make sure they are durable and safe. What I haven’t talked about is what you put in the journal. Carsten reminded me of this lack, and I want to thank him for that.

The first thing we need to understand is what the journal is supposed to do. The whole point of the journal is to make sure that you if you had some sort of error (including power loss), you can use the information on the journal to recover up to the same point you were at before the failure. More formally, in order to maintain ACID, we need to ensure that any transactions we committed (so clients rely on that) are there, and any ongoing transactions have been rolled back properly. The journal is the key to that, but how?

A lot of this depends on the database engine itself, and that has an impact on the file format you used in the journal. The way you work with the journal has also a lot to do with the internals of the database.

Let us take a relational database as an example. We want to insert a new row to a table. The size of the row is usually pretty small, a few dozen to a few hundred bytes. So it’s cool, but how does it play into the journal? Well, before the database can actually modify the data, it needs to write its intent to do so in the journal, and flush it. Only then can it proceed, knowing that there is a stable record in the case of an error.

One way of doing this is to write the following this record into the journal file:

{ position: 1234, value: [binary] }

After it is flushed, we can go ahead and modify the file itself. If we crash, during recovery we’ll see that we have this entry in the journal, and we’ll write it again to the same place in the data file. Either this will be a no-op, because it was previously applied, or we’ll re-apply the change. At any rate, as an external observer, the fact that the journal entry exists ensures that on recovery, the value will be the same. Hence, the fact the entry was written and flushed to the journal ensures that the transaction change was committed.

So this is the high level overview. The devil is in the details. The simplest journal file just records binary data and position, so we can write it out to the data file on recovery. But while that works, it is limiting the database engine in what it can do. If you have multiple concurrent transactions all of which are generating entries to the log, you don’t want to force them to be written to the journal only on transaction commit, you want them to be appended to the log and flushed (so you can amortize the cost), and you want to write them out immediately.

But this means that you are writing uncommitted changes to the journal file. So each of your entry also has a transaction number, and your transaction commit is another entry in the journal that orders to apply all operations from that particular transaction. At this point, you usually have different actors inside the database engine. You have an actor that is responsible for writing to the journal file, and one is typically merging multiple entries from multiple concurrent transactions to allow the maximum level of performance. Consider the implications of the following journal actor implementation:

All pending entries to the journal are actually written using buffered I/O, so they are very fast. However, there are a few things to notice here.

  • We keep a record of the hash (CRC, MD5, etc) of all the writes.
  • When we get a transaction commit entry, we write it to the disk, and then write the hash for all the entries that were written since the last transaction commit.
  • We flush to disk, ensuring that we are actually persisting on spinning rust.
  • We let the caller know the transaction has been safely journaled to disk.

This code has a lot of tiny implications that are not immediately obvious. For example, whenever we send a journal entry to be written, we don’t need to wait for it, we can proceed immediately to the next change in the transaction. And because the writes are buffered, even the I/O on the journal actor is very cheap.

However, when we send a commit transaction entry, we do a few more things. Writing the hash of the all the entries that were written since the last transaction allows us to verify that all entries that were written were written successfully. If there was a power failure while we were writing the transaction, we would know and realize that this transaction isn’t committed, and that is where the log ends.

And while I don’t need to wait for the journal entry to be flushed to disk, I do have to wait for the transaction itself to be written to disk before I let the user know that it has been committed. This type of structure also has the advantage of transactions sharing the load. If we have a long transaction that does something, its journal entries will be flushed to disk along with the other committing transactions. When we need to commit the long transaction, the amount of work we’ll actually have to do is a lot less.

The structure of the journal entry can range from the simple mode of writing what binary data to modify where, to actually have meaning for the database engine (SET [column id]=[value]). The latter is more complex, but it gives you more compact representation for journal entries, which means that you can pack more of them in the same space and I/O is at a premium.

For the technical reasons mentioned in previous posts (alignment, performance, etc.), we typically write only on page boundaries (in multiples of 4KB), so we need to consider whether it is actually worth our time to write things now, or wait a bit and see if there is additional data coming that can complete the target boundary.

What I described so far is one particular approach to handle that. It is used by databases such as PostgresSQL, Cassandra, etc. But it doesn’t work quite in this manner. In the case of something like LevelDB, the journal is written one transaction at a time, under the lock, and in multiples of 32KB. The values in the journal are operations to perform (add / delete from the database), and that is pretty much it. It can afford to do that because all of its data files are immutable. PostgresSQL uses 8KB multiples and only stores in the journal only the data it needs to re-apply the transaction. This is probably because of the MVCC structure it has.

SQL Server, on the other hand, stores both redo and undo information. It make sense, if you look at the journal actor above. Whenever we write an entry to the journal file, we don’t yet know if the transaction would be committed. So we store the information we need to redo it (if committed) and undo it (if it didn’t). Recovery is a bit more complex, and you can read about it the algorithm used most frequently (at least as the base) here: ARIES.

With Voron, however, we choose to go another way. Each transaction is going to keep track of all the pages it modified. And when the transaction commits, we take all of those pages and compress them (to reduce the amount of I/O we have to do), compute a hash of the compressed data, and write it on 4KB boundary. Recovery then becomes trivial. Run through the journal file, and verify each transaction hash at a time. Once this is done, we know that the transaction is valid, so we can decompress the dirty pages and write them directly to the data file. Instead of handling operations log, we handle full pages. This means we don’t actually care what modifications run on that page, we just care about its state.

It makes adding new facilities to Voron very simple, because there is a very strict layering throughout, changing the way we do something has no impact on the journaling / ACID layer.

time to read 2 min | 369 words

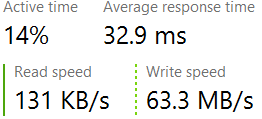
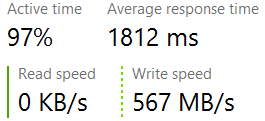
I’m currently in the process of getting some benchmark numbers for a process we have, and I was watching some metrics along the way. I have mentioned that disk’s speed can be effected by quite a lot of things. So here are two metrics, taken about 1 minute apart in the same benchmark.

This is using a Samsung PM871 512GB SSD drive, and it is currently running on a laptop, so not the best drive in the world, but certainly a respectable one.

Here is the steady state operation while we are doing a lot of write work. Note that the response time is very high, in computer terms, forever and a half:

image

And here is the same operation, but now we need to do some cleanup and push more data to the disk, in which case, we get great performance.

image

But oh dear good, just look at the latency numbers that we are seeing here.

Same machine, local hard disk (and SSD to boot), and we are seeing latency numbers that aren’t even funny.

In this case, the reason for this is that we are flushing the data file along side the journal file. In order to allow to to proceed as fast as possible, we try to parallelize the work so even though the data file flush is currently holding most of the I/O, we are still able to proceed with minimal hiccups and stall as far as the client is concerned.

But this can really bring home the fact that we are actually playing with a very limited pipe, and there little that we can do to control the usage of the pipe at certain points (a single fsync can flush a lot of unrelated stuff) and there is no way to throttle things and let the OS know (this particular flush operation should take more than 100MB/s, I’m fine with it taking a bit longer, as long as I have enough I/O bandwidth left for other stuff).

time to read 5 min | 922 words

This is a fun series to write, but I’m running out of topics where I can speak about the details at a high level without getting into nitty gritty details that will make no sense to anyone but database geeks. If you have any suggestions for additional topics, I would love to hear about them.

This post, however, is about another aspect of running a database engine. It is all about knowing what is actually going on in the system. A typical web application has very little state (maybe some caches, but that is pretty much about it) and can be fairly easily restarted if you run into some issue (memory leak, fragmentation, etc) to recover most problems while you investigate exactly what is going on. A surprising number of production systems actually have this feature that they just restart on a regular basis, for example. IIS will restart a web application every 29 hours, for example, and I have seen production deployment of serious software where the team was just unaware of that. It did manage to reduce a lot of the complexity, because the application never got around to live long enough to actually carry around that much garbage.

A database tend to be different. A database engine lives for a very long time, typically weeks, months or years, and it is pretty bad when it goes down, it isn’t a single node in the farm that is temporarily missing or slow while it is filling the cache, this is the entire system being down without anything that you can do about it (note, I’m talking about single node systems here, distributed systems has high availability systems that I’m ignoring at the moment). That tend to give you a very different perspective on how you work.

For example, if you are using are using Cassandra, it (at least used to) have an issue with memory fragmentation over time. It would still have a lot of available memory, but certain access pattern would chop that off into smaller and smaller slices, until just managing the memory at the JVM level caused issues. In practice, this can cause very long GC pauses (multiple minutes). And before you think that this is an situation unique to managed databases, Redis is known to suffer from fragmentation as well, which can lead to higher memory usage (and even kill the process, eventually) for pretty much the same reason.

Databases can’t really afford to use common allocation patterns (so no malloc / free or the equivalent) because they tend to hold on to memory for a lot longer, and their memory consumption is almost always dictated by the client. In other words, saving increasing large record will likely cause memory fragmentation, which I can then utilize further by doing another round of memory allocations, slightly larger than the round before (forcing even more fragmentation, etc).  Most databases use dedicated allocators (typically some from of arena allocators) with limits that allows them to have better control of that and mitigate that issue. (For example, by blowing the entire arena on failure and allocating a new one, which doesn’t have any fragmentation).

But you actually need to build this kind of thing directly into the engine, and you need to also account for that. When you have a customer calling with “why is the memory usage going up”, you need to have some way to inspect this and figure out what to do about that. Note that we aren’t talking about memory leaks, we are talking about when everything works properly, just not in the ideal manner.

Memory is just one aspect of that, if one that is easy to look at. Other things that you need to watch for is anything that has a linear cost proportional to your runtime. For example, if you have a large LRU cache, you need to make sure that after a couple of months of running, pruning that cache isn’t going to be an O(N) job running every 5 minutes, never finding anything to prune, but costing a lot of CPU time. The number of file handles is also a good indication of a problem in some cases, some databases engines have a lot of files open (typically LSM ones), and they can accumulate over time until the server is running out of those.

Part of the job of the database engine is to consider not only what is going on now, but how to deal with (sometimes literally) abusive clients that try to do very strange things, and how to manage to handle them. In one particular case, a customer was using a feature that was designed to have a maximum of a few dozen entries in a particular query to pass 70,000+ entries. The amazing thing that this worked, but as you can imagine, all sort of assumptions internal to the that features were very viciously violated, requiring us to consider whatever to have a hard limit on this feature, so it is within its design specs or try to see if we can redesign the entire thing so it can handle this kind of load.

And the most “fun” is when those sort of bugs are only present after a couple of weeks of harsh production systems running. So even when you know what is causing this, actually reproducing the scenario (you need memory fragmented in a certain way, and a certain number of cache entries, and the application requesting a certain load factor) can be incredibly hard.

time to read 4 min | 684 words

A lot of the complexities involved in actually building a database engine aren’t related to the core features that you want to have. They are related to what looks like peripheral concerns. Backup / restore is an excellent example of that.

Obviously, you want your database engine to have support for backup and restore. But at the same time, actually implementing that (efficiently and easily) is not something that can be done trivially. Let us consider Redis as a good example; in order to backup its in memory state, Redis will fork a new process, and use the OS’s support for copy on write to have a stable snapshot of the in-memory state that it can then write to disk. It is a very elegant solution, with very little code, and it can be done with the assistance of the operation system (almost always a good thing).

It also exposes you to memory bloat if you are backing up to a slow disk (for example, a remote machine) at the same time that you have a lot of incoming writes. Because the OS will create a copy of every memory page that is touched as long as the backup process is running (on its own copy of the data), the amount of memory actually being used is non trivial. This can lead to swapping, and in certain cases, the OS can decide that it runs out of memory and just start killing random processes (most likely, the actual Redis server that is being used, since it is the consumer of all this memory).

Another consideration to have is exactly what kind of work do you have to do when you restore the data. Ideally, you want to be up and running as soon as possible. Given database sizes today, even reading the entire file can be prohibitively expensive, so you want to be able to read just enough to start doing the work, and then complete the process of finishing up the restore later (while being online). The admin will appreciate it much more than some sort of a spinning circle or a progress bar measuring how long the system is going to be down.

The problem with implementing such features is that you need to consider the operating environment in which you are working. The ideal case is if you can control such behaviors, for example, have dedicated backup & restore commands that the admin will use exclusively. But in many cases, you have admins that do all sorts of various things, from shutting down the database and zipping to a shared folder on a nightly basis to taking a snapshot or just running a script with copy / rsync on the files on some schedule.

Some backup products have support for taking a snapshot of the disk state at a particular point in time, but this goes back to the issues we raised in a previous post about low level hooks. You need to be aware of the relevant costs and implications of those things. In particular, most databases are pretty sensitive to the order in which you backup certain files. If you take a snapshot of the journal file at time T1, but the data file at time T2, you are likely to have data corruption when you restore (the data file contains data that isn’t in the journal, and there is no way to recover it).

The really bad thing about this is that it is pretty easy for this to mostly work, so even if you have a diligent admin who test the restore, it might actually work, except when it will fail when you really need it.

And don’t get me started on cloud providers / virtual hosts that offer snapshots. The kind of snapshotting capabilities that a database requires are very specific (all changes that were committed to disk, in the order they were sent, without any future things that might be in flight) in order to be able to successfully backup & restore. From experience, those are not the kind of promises that you get from those tools.

time to read 4 min | 799 words

With all the focus on writing to disk and ensuring the high speed of the database, I almost missed a very important aspect of databases, how do we actually communicate with the outside world.

In many cases, there is no need for that. Many databases just run either embedded only (LevelDB, LMDB, etc) or just assume that this is someone else’s problem, pretty much. But as it turn out, if you aren’t an embedded database, there is quite a bit that you need to get right when you are working on the network code. For the rest of this post, I’m going to assume that we are talking about a database that clients connect to through the network. It can be either locally (shared memory / pipes / UNIX sockets / TCP) or remotely (pretty much only TCP at this point).

The actual protocol format don’t really matter. I’m going to assume that there is some sort of a streaming connection (think TCP socket) and leave it at that. But the details of how the database communicate are quite important.

In particular, what kind of communication do we have between client and server. Is each request independent of one another, are there conversations, what kind of guarantees do we give for the lifetime of the connection, etc?

Relational databases use a session protocol, in which the client will have a conversation with the server, composed of multiple separate request / replies. Sometimes you can tell the server “just process the requests as fast as you can, and send the replies as well, but don’t stop for sending replies”, which helps, but this is probably the worst possible way to handle this. The problem is that you need a connection per client, and those conversation can be pretty long, so you hold up to the connection for a fairly long duration, which means that you have to wait for the next part of the conversation to know what to do next.

A better approach is to dictate that all operations are strictly one way, so once the server has finished processing a request, it can send the reply to the client and move on to process the next request (from the same client or the other one) immediately. In this case, we have several options, we can pipeline multiple requests on the same channel (allowing out of order replies for requests / replies), we can use the serial nature of TCP connections and have a pool of connections that we can share among clients.

An even better method is if you can combine multiple requests from the server to a single reply from the server. This can be useful if you know that the shape of all the commands are going to be same (for example, if you are asked in insert a million records, you can process them as soon as possible, and only confirm that you accepted every ten thousands or so). It may sound silly, but those kind of things really add up, because the client can just pour the data in and the server will process it as soon as it can.

Other considerations that you have to take into account in the communication protocol is security and authentication. If you are allowing remote clients, then they need some way to authenticate. And that can be expensive (typically authentication required multiple round trips between server & client to verify the credentials, and potentially and out of server check in something like LDAP directory), so you want to authenticate once and then keep on to the same connection for as long as you can.

A more problematic issues comes when talking about the content of your conversation with the database, you typically don’t want to send everything over plain text, so you need to encrypt the channel, which has its own costs. For fun, this means dealing with things like certificates, SSL and pretty complex stuff that very few properly understand. If you can get away with letting something else do that for you, see if you can. Setting up a secured connection that cannot be easily bypassed (man in the middle, fake certs, just weak encryption, etc) is none trivial, and should be left for experts in their field.

Personally, I like to just go with HTTPS for pretty much all of that, because it take a lot of the complexity away, and it means that all the right choices has probably already been made for me. HTTPS, of course, is a request/reply, but things like connection pooling, keep-alive and pipelining can do quite a lot to mitigate that in the protocol level. And something like Web Sockets allows to have most of the benefits of TCP connections, with a lot of the complexity handled for you.

time to read 4 min | 747 words

You might have noticed a theme here in the past few posts. In order to achieve a good performance and ensure the stability of the system, most database engines has a pretty good relationship with the low level hardware and operating system internals.

You pretty much have to do that, because you want to be able to squeeze every last bit of performance of the system. And it works, quite well, until people start lying to you. And by people, I mean all sort of stuff.

The most obvious one is the hardware. If I’m asking the hardware “please make sure that this is on persisted medium”, and the hardware tell me “sure”, but does not such thing. There is very little that the database engine can do. There are quite a lot of drives there that flat out lie about this. Typically enterprise grade drives will not do that unless you have them configured to survive power loss (maybe they have a battery backup?), but I have seen some production systems that were hard to deal with because of that.

Another common case is when administrators put the database on a remote server. This can be because they have a shared storage setup, or are used to putting all their eggs in one basket, or maybe they already have backup scripts running in that location. Whatever the actual reason, it means that every I/O operation we do (already quite expensive) is now turned into a network call (which still need to do I/O on the other side), so that mess up completely the cost benefit analysis the database does on when to actually call the hardware.

Sometimes you have an attached storage directly to the server, with high end connection that provides awesome I/O and allow you to stripe among multiple drives easily. Sometimes, that is the shared storage for the entire company, and you have to compete for I/O with everything else.

But by far the most nefarious enemy we have seen is Anti Virus of various kinds. This problem is mostly on Windows, where admins will deploy an Anti Virus almost automatically, and set it to the most intrusive levels possible, but I have seen similar cases on Linux with various kernel extensions that interfere with how the system works. In particular, timing and contracts are sometimes (often) are broken by such products, and because it is done in an extremely low level manner, the database engine typically has no idea that this happened, or how to recover. For fun, trying to figure out if an Anti Virus is installed (so you can warn the admin to set it up correctly) is one of the behaviors that most Anti Virus will look for and flag you as a virus.

Now, we have run into this with Anti Virus a lot, but the same applies for quite a lot of things. Allowing an indexing service to scan the database files, or putting them on something like Dropbox folder or pretty much anything that interfere with how the data gets persisted to disk will cause issues. And when that happens, it can be really tricky to figure out who is at fault.

Finally, and very common today, we have the cloud. The I/O rates in the cloud are typically metered, and in some clouds you get I/O rates that you would from a bad hard disk 10 years ago. What is worst, because the cloud environment is often shared, it means that you are very vulnerable to noisy neighbors. And that means that two identical I/O requests will complete, the first in 25ms, and the second in 5,000 ms (not a mistake, that is 5 seconds!).  Same file, same system, same size of request, same everything, spaced two seconds apart, and you hit something, and your entire performance work goes down the drain. You can get reserved IOPS, which helps, but you need to check what you are getting. On some clouds you get concurrent IOPS, which is nice, but the cost of serial IOPS (critical for things like journals) remains roughly the same. This is especially true if you need to make unbuffered I/O, or use fsync() on those systems.

We have actually had to add features to the product to measure I/O rates independently, so we can put the blame where it belongs (your drives gives me 6 MB/sec on our standard load, this is the maximum performance I can give under this situation).

time to read 3 min | 556 words

imageSo, we now know how we can write to a journal file efficiently, but a large part of doing that is relying on the fact that we are never actually going to read from the journal file. In other words, this is like keeping your receipts in case of an audit. You do that because you have to, but you really don’t want to ever need it, and you just throw it in the most efficient way to a drawer and will sort if out when you need to.

In most database engines that implement a journal, there is this distinction, the journal is strict for durability and recovery, and the data file(s) are used to actually store the data in order to operate. In our case, we’ll assume a single journal and a single data file.

On every commit, we’ll write to the journal file, as previously discussed, and we ensure that the data is safely on the disk. But what happens to writes on the data file?

Simple, absolutely nothing. Whenever we need to write to the data file, we make buffered writes into the data file, which goes into the big chain of buffers that merge / reorder and try to optimize our I/O. Which is great, because we don’t really need to care about that. We can let the operating system handle all of that.

Up to a point, of course.

Every now and then, we’ll issue an fsync on the data file, forcing the file system to actually flush all those buffered writes to disk. We can do this in an async manner, and continue operations on the file. At the time that the fsync is done (which can be a lot of time, if we had a lot of write and a busy server), we know what is the minimum amount of data that was already written to the data file and persisted on disk. Since we can match it up to the position of the data on the journal, we can safely say that the next time we recover, we can start reading the journal from that location.

If we had additional writes, from later in the journal file, that ended up physically in the data file, it doesn’t matter, because they will be overwritten by the journal entries that we have.

Doing it this way allows us to generate large batches of I/O, and in most cases, allow the operating system the freedom to flush things from the buffers on its own timeline, we just make sure that this doesn’t get into degenerate case (where we’ll need to read tens of GB of journal files) by forcing this every now and then, so recovery is fast in nearly all cases.

All of this I/O tend to happen in async thread, and typical deployments will have separate volumes for logs and data files, so we can parallelize everything instead of competing with one another.

By the way, I’m running this series based on my own experience in building databases, and I’m trying to simplify it as much as it is possible to simplify such a complex topic. If you have specific questions / topics you’ll like me to cover, I’ll be happy to take them.

FUTURE POSTS

  1. Partial writes, IO_Uring and safety - about one day from now
  2. Configuration values & Escape hatches - 4 days from now
  3. What happens when a sparse file allocation fails? - 6 days from now
  4. NTFS has an emergency stash of disk space - 8 days from now
  5. Challenge: Giving file system developer ulcer - 11 days from now

And 4 more posts are pending...

There are posts all the way to Feb 17, 2025

RECENT SERIES

  1. Challenge (77):
    20 Jan 2025 - What does this code do?
  2. Answer (13):
    22 Jan 2025 - What does this code do?
  3. Production post-mortem (2):
    17 Jan 2025 - Inspecting ourselves to death
  4. Performance discovery (2):
    10 Jan 2025 - IOPS vs. IOPS
View all series

Syndication

Main feed Feed Stats
Comments feed   Comments Feed Stats
}