Oren Eini

CEO of RavenDB

a NoSQL Open Source Document Database

Get in touch with me:

oren@ravendb.net +972 52-548-6969

Posts: 7,546
|
Comments: 51,162
Privacy Policy · Terms
filter by tags archive
time to read 3 min | 515 words

So, as I noted in a previous post, we loaded RavenDB with all of the music CDs in existence (or nearly so). A total of 3.1 million disks and 43 million tracks. And we had some performance problems. But we got over them, and I am proud to give you the results:

  Old New
Importing Data Couple of hours 42 minutes
Raven/DocumentsByEntityName And hour and a half 23.5 minutes
Simple index over disks Two hours and twenty minutes 24.1 minutes
Full text index over disks and tracks More than seven hours 37.5 minutes

Tests were run on the same machine, and the database HD was  a single 300 GB 7200 RPM drive.

I then decided to take this one step further, and check what would happen when we already had the indexes. So we created three indexes. One Raven/DocumentsByEntityName, one for doing simple querying over disks and one for full text searches on top of all disks and tracks.

With 3.1 million documents streaming in, and three indexes (at least one of them decidedly non trivial), the import process took an hour and five minutes. Even more impressive, the indexing process was fast enough to keep up with the incoming data so we only had about 1.5 seconds latency between inserting a document and having it indexed. (Note that we usually seem much lower times for indexing latencies, usually in the low tens of milliseconds, when we aren’t being bombarded with documents).

Next up, and something that we did not optimize, was figuring out how costly it would be to query this. I decided to go for the big guns, and tested querying the full text search index.

Testing “Query:Adele” returned a result (from a cold booted database) in less than 0.8 seconds. But remember, this is after a cold boot. So let us see what happen when we issue a few other queries?

  • Query:Pearl - 0.65 seconds
  • Query:Abba – 0.67 seconds
  • Query:Queen – 0.56 seconds
  • Query:Smith – 0.55 seconds
  • Query:James – 0.77 seconds

Note that I am querying radically different values, so I force different parts of the index to load.

Querying for “Query:Adele” again? 32 milliseconds.

Let us see a few more:

  • Query:Adams – 0.55 seconds
  • Query:Abrahams – 0.6 seconds
  • Query:Queen – 85 milliseconds
  • Query:James – 0.1 seconds

Now here are a few things that you might want to consider:

  1. We have done no warm up to the database, just started it up from cold boot and started querying.
  2. I actually think that we can do better than this, and this is likely to be the next place we are going to focus our optimization efforts.
  3. We are doing a query here over 3.1 million documents, using full text search.
  4. There is no caching involved in the speed increases.

More goodies are coming in.

time to read 5 min | 940 words

Update: The numbers in this post are not relevant. I include them here solely so you would have a frame of reference. We have done a lot of optimization work, and the numbers are orders of magnitude faster now. See the next post for details.

The purpose of this post is to setup a scenario, see how RavenDB do with it, and then optimize the parts that we don’t like. This post is scheduled to go about two months after it was written, so anything that you see here is likely already fixed. In future posts, I’ll talk about the optimizations, what we did, and what was the result.

System note: I run those tests on a year old desktop, with all the database activity happening on a single 7200 RPM 300GB disk with 8 GB of RAM. Please don’t get to hung up on the actual numbers, I include them for reference, but real hardware on production system should kick this drastically higher. Another thing to remember is that this was an active system, while all of those operations were running, I was actively working and developing on the machine. The main point is to give us some sort of a metric about where we are, and to see whatever we like this or not.

We keep looking at additional things that we can do with RavenDB, and having large amount of information to tests things with is awesome. Having non fake data is even awesomer, because fake data is predictable data, while real data tend to be much more… interesting.

That is why I decided to load the entire freedb database into RavenDB and see what is happening.

What is freedb?

freedb is a database to look up CD information using the internet. This is done by a client (a freedb aware application) which calculates a (nearly) unique disc ID for a CD in your CD-Rom and then queries the database. As a result, the client displays the artist, CD-title, tracklist and some additional info.

The nice thing about freedb is that you can download their data* and make use of it yourself.

* The not so nice thing is that the data is in free form text format. I wrote a parser for it if you really want to use it, which you can find here: https://github.com/ayende/XmcdParser


So I decided to push all of this data into RavenDB. The import process took a couple of hours (didn’t actually measure, so I am not sure exactly how much), and we ended up with a RavenDB database with: 3,133,903 documents. Memory usage during the import process was ~100  MB – 150 MB (no indexes were present).

The actual size in RavenDB is 3.59 GB with 3.69 GB reserved on the file system.

Starting the database from cold boot takes about 4 seconds.

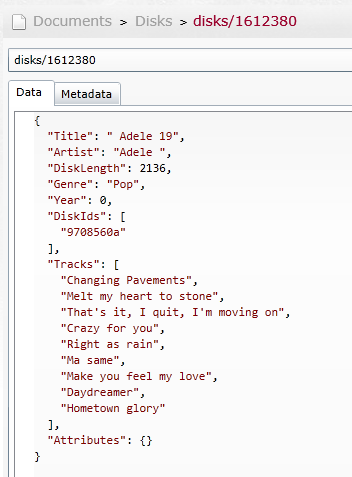
This is what the document looks like:

image

A full backup of the database took about 3 minutes, with all of the time dedicate for pure I/O.

Doing an export, using smuggler (on the local machine, 128 document batches) took about 18 minutes and resulted in a 803MB file (not surprising, smuggler output is a compressed file).

Note that we created this in a completely empty database, so the next step was to actually create an index and see how the database behaves. We create the default Raven/DocumentsByEntityName index, and got 5,870 seconds, so just over an hour and a half. For what it worth, this resulted in on disk index with a size of 125MB.

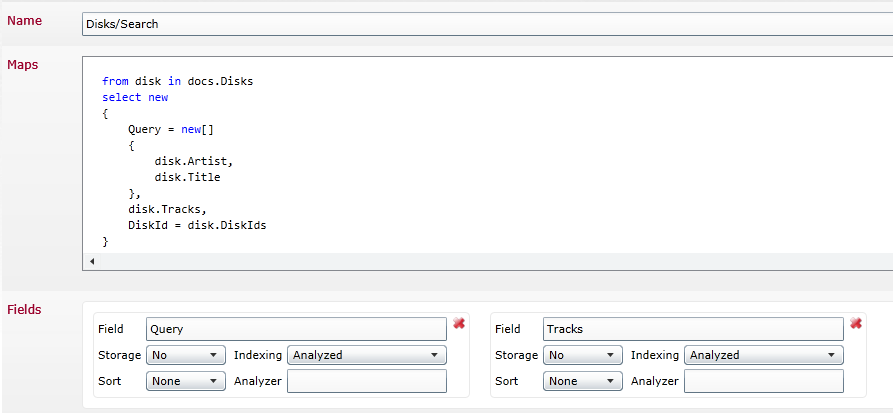
I then tried a much more complex index:

image

Just to give you some idea, this index gives you full text search support over just about every music cd that was ever made. To be frank, this index scares me, because it means that we have to have index entry for every single track in the world.

After indexing was completed, we ended up with a 700 MB on disk presence. Indexing took about 7 hours to complete. That is a lot, but remember what we are dealing with, we indexed 3.1 million documents, but we actually indexed, 52,561,894 values (remember, we index each and every track).  The interesting bit is that while it took a lot of CPU (full text indexing usually does) memory usage was relatively low, it peaked about 300 MB and usually was around the 180MB).

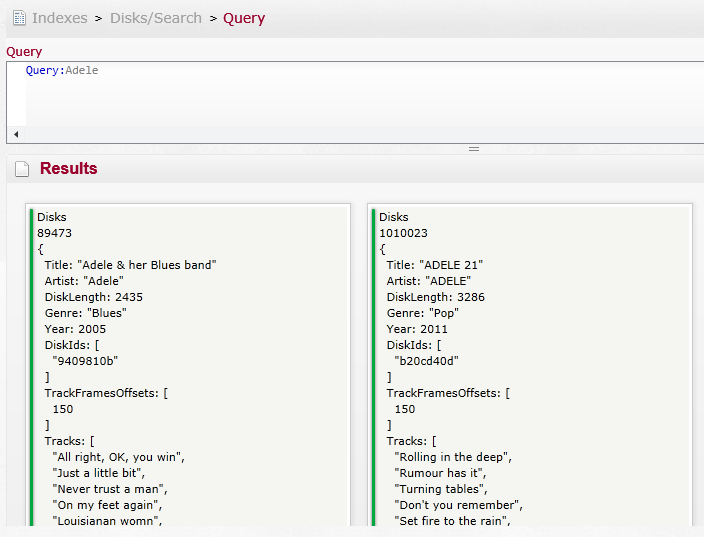
Searching over this index is not as fast as I would like, taking about a second to complete. Then again, the results are quite impressive:

image

Well, given that this is the equivalent of a 52 million records (in this case, literally records Smile) , and we are performing full text search, quite nice.

Let us see what happens when do something a little simpler, shall we?

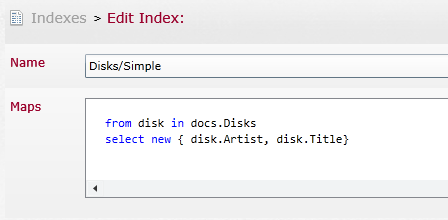
image

In this case, we are only indexing 3.1 millions documents, and we don’t do full text searches. This index took 2.3 hours to run.

Queries on that are a much more satisfactory rate of starting out at 75 ms and dropping to 5 ms very quickly.

FUTURE POSTS

  1. Partial writes, IO_Uring and safety - about one day from now
  2. Configuration values & Escape hatches - 4 days from now
  3. What happens when a sparse file allocation fails? - 6 days from now
  4. NTFS has an emergency stash of disk space - 8 days from now
  5. Challenge: Giving file system developer ulcer - 11 days from now

And 4 more posts are pending...

There are posts all the way to Feb 17, 2025

RECENT SERIES

  1. Challenge (77):
    20 Jan 2025 - What does this code do?
  2. Answer (13):
    22 Jan 2025 - What does this code do?
  3. Production post-mortem (2):
    17 Jan 2025 - Inspecting ourselves to death
  4. Performance discovery (2):
    10 Jan 2025 - IOPS vs. IOPS
View all series

Syndication

Main feed Feed Stats
Comments feed   Comments Feed Stats
}